MetLife 2011 Annual Report Download - page 36
Download and view the complete annual report
Please find page 36 of the 2011 MetLife annual report below. You can navigate through the pages in the report by either clicking on the pages listed below, or by using the keyword search tool below to find specific information within the annual report.-
 1
1 -
2
-
3
-
4
-
5
-
6
-
7
-
8
-
9
-
10
-
11
-
12
-
13
-
14
-
15
-
16
-
17
-
18
-
19
-
20
-
21
-
22
-
23
-
24
-
25
-
 26
26 -
 27
27 -
 28
28 -
 29
29 -
 30
30 -
 31
31 -
 32
32 -
 33
33 -
 34
34 -
 35
35 -
 36
36 -
 37
37 -
 38
38 -
 39
39 -
 40
40 -
 41
41 -
 42
42 -
 43
43 -
 44
44 -
 45
45 -
 46
46 -
47
-
48
-
49
-
50
-
51
-
52
-
53
-
54
-
55
-
56
-
57
-
58
-
59
-
60
-
61
-
62
-
63
-
64
-
65
-
66
-
67
-
68
-
69
-
70
-
71
-
72
-
73
-
74
-
75
-
76
-
77
-
78
-
79
-
80
-
81
-
82
-
83
-
84
-
85
-
86
-
87
-
88
-
89
-
90
-
91
-
92
-
93
-
94
-
95
-
96
-
97
-
98
-
99
-
100
-
101
-
102
-
103
-
104
-
105
-
106
-
107
-
108
-
109
-
110
-
111
-
112
-
113
-
114
-
115
-
116
-
117
-
118
-
119
-
120
-
121
-
122
-
123
-
124
-
125
-
126
-
127
-
128
-
129
-
130
-
131
-
132
-
133
-
134
-
135
-
136
-
137
-
138
-
139
-
140
-
141
-
142
-
143
-
144
-
145
-
146
-
147
-
148
-
149
-
150
-
151
-
152
-
153
-
154
-
155
-
156
-
157
-
158
-
159
-
160
-
161
-
162
-
163
-
164
-
165
-
166
-
167
-
168
-
169
-
170
-
171
-
172
-
173
-
174
-
175
-
176
-
177
-
178
-
179
-
180
-
181
-
182
-
183
-
184
-
185
-
186
-
187
-
188
-
189
-
190
-
191
-
192
-
193
-
194
-
195
-
196
-
197
-
198
-
199
-
200
-
201
-
202
-
203
-
204
-
205
-
206
-
207
-
208
-
209
-
210
-
211
-
212
-
213
-
214
-
215
-
216
-
217
-
218
-
219
-
220
-
221
-
222
-
223
-
224
-
225
-
226
-
227
-
228
-
229
-
230
-
231
-
232
-
233
-
234
-
235
-
236
-
237
-
238
-
239
-
240
-
241
-
242
-
243
 |
 |

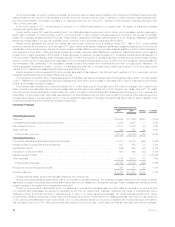
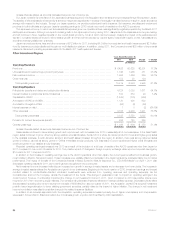
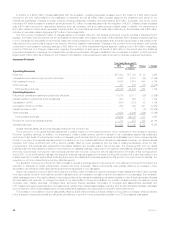
In addition to a $269 million increase associated with the Acquisition, operating expenses increased due to the impact of a $95 million benefit
recorded in the prior period related to the pesification in Argentina, as well as a $60 million increase related to the investment and growth in our
international businesses. Changes in foreign currency exchange rates also increased other expenses by $54 million. In addition, the current period
includes a $14 million increase in charitable contributions and $13 million of costs associated with the integration of ALICO. Offsetting these increases
was a $76 million reduction in discretionary spending, such as consulting, rent and postemployment related costs. In addition, we experienced a
$47 million decline in market driven expenses, primarily pension and post retirement benefit costs. Also contributing to the decrease was a $35 million
reduction in real estate-related charges and $15 million of lower legal costs.
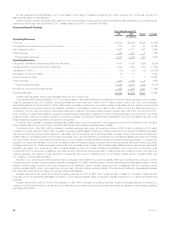
The 2010 period includes $75 million of charges related to the Health Care Act. The Federal government currently provides a Medicare Part D
subsidy. The Health Care Act reduced the tax deductibility of retiree health care costs to the extent of any Medicare Part D subsidy received beginning
in 2013. Because the deductibility of future retiree health care costs is reflected in our financial statements, the entire future impact of this change in law
was required to be recorded as a charge in the period in which the legislation was enacted. Changes to the provision for income taxes in both periods
contributed to an increase in operating earnings of $86 million for our Other International Regions segment, resulting from a $34 million unfavorable
impact in 2009 due to a change in assumption regarding the repatriation of earnings and a benefit of $52 million in the current year from additional
permanent reinvestment of earnings, the reversal of tax provisions and favorable changes in liabilities for tax uncertainties. In addition, in 2009 we had a
larger benefit of $82 million as compared to 2010 related to the utilization of tax preferenced investments which provide tax credits and deductions.
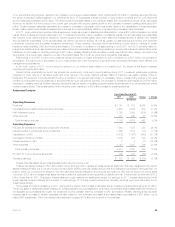
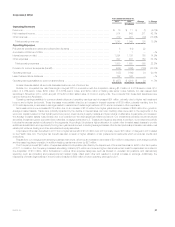
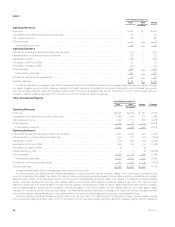
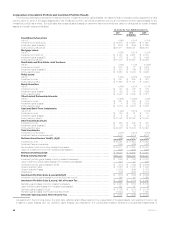
Insurance Products
Years Ended December 31,
2010 2009 Change % Change
(In millions)
Operating Revenues
Premiums .......................................................................... $17,200 $17,168 $ 32 0.2%
Universal life and investment-type product policy fees ........................................ 2,247 2,281 (34) (1.5)%
Net investment income ............................................................... 6,068 5,614 454 8.1%
Other revenues ..................................................................... 761 779 (18) (2.3)%
Total operating revenues ............................................................ 26,276 25,842 434 1.7%
Operating Expenses
Policyholder benefits and claims and policyholder dividends ................................... 19,075 19,111 (36) (0.2)%
Interest credited to policyholder account balances .......................................... 963 952 11 1.2%
Capitalization of DAC ................................................................. (841) (873) 32 3.7%
Amortization of DAC and VOBA ......................................................... 966 725 241 33.2%
Interest expense on debt .............................................................. 1 6 (5) (83.3)%
Other expenses ..................................................................... 4,080 4,206 (126) (3.0)%
Total operating expenses ............................................................ 24,244 24,127 117 0.5%
Provision for income tax expense (benefit) ................................................. 711 573 138 24.1%
Operating earnings ................................................................... $ 1,321 $ 1,142 $ 179 15.7%
Unless otherwise stated, all amounts discussed below are net of income tax.
The improvement in the global financial markets had a positive impact on net investment income, which contributed to the increase in Insurance
Products’ operating earnings. In addition, we experienced overall modest revenue growth in several of our businesses despite this challenging
environment. High levels of unemployment continue to depress growth across most of our group insurance businesses due to lower covered payrolls.
Growth in our group life business was dampened by a decline in our non-medical health and individual life businesses. However, our dental business
benefited from higher enrollment and pricing actions, partially offset by lower persistency and the loss of existing subscribers, driven by high
unemployment. This business also experienced more stable utilization and benefits costs in the current year. The revenue growth from our dental
business was more than offset by a decline in revenues from our disability business, mainly due to net customer cancellations, changes in benefit levels
and lower covered lives. Our long-term care revenues were flat year over year, concurrent with the discontinuance of the sale of this coverage at the
end of 2010. In our individual life business, the change in revenues was suppressed by the impact of a benefit recorded in the prior year related to the
positive resolution of certain legal matters. Excluding this impact, the traditional life business experienced 8% growth in our open block of business. The
expected run-off of our closed block more than offset this growth.
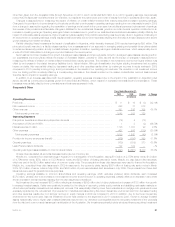
The significant components of the $179 million increase in operating earnings were an improvement in net investment income and the impact of a
reduction in dividends to certain policyholders, coupled with lower expenses. These improvements were partially offset by an increase in DAC
amortization, as well as net unfavorable claims experience across several of our businesses.
Higher net investment income of $295 million was due to a $202 million increase from growth in average invested assets and a $93 million increase
from higher yields. Growth in the investment portfolio was attributed to an increase in net cash flows from the majority of our businesses. The increasein
yields was largely due to the positive effects of recovering private equity markets and stabilizing real estate markets on other limited partnership interests
and real estate joint ventures. To manage the needs of our intermediate to longer-term liabilities, our portfolio consists primarily of investment grade
corporate fixed maturity securities, mortgage loans, structured finance securities (comprised of mortgage and asset-backed securities) and
U.S. Treasury and agency securities and, to a lesser extent, certain other invested asset classes, including other limited partnership interests, real estate
joint ventures and other invested assets which provide additional diversification and opportunity for long-term yield enhancement.
The increase in net investment income was partially offset by a $36 million increase in interest credited on long duration contracts, which is reflected
in the change in policyholder benefits and dividends, primarily due to growth in future policyholder benefits in our LTC and disability businesses.
32 MetLife, Inc.