MetLife 2011 Annual Report Download - page 155
Download and view the complete annual report
Please find page 155 of the 2011 MetLife annual report below. You can navigate through the pages in the report by either clicking on the pages listed below, or by using the keyword search tool below to find specific information within the annual report.-
 1
1 -
2
-
3
-
4
-
5
-
6
-
7
-
8
-
9
-
10
-
11
-
12
-
13
-
14
-
15
-
16
-
17
-
18
-
19
-
20
-
21
-
22
-
23
-
24
-
25
-
26
-
27
-
28
-
29
-
30
-
31
-
32
-
33
-
34
-
35
-
36
-
37
-
38
-
39
-
40
-
41
-
42
-
43
-
44
-
45
-
46
-
47
-
48
-
49
-
50
-
51
-
52
-
53
-
54
-
55
-
56
-
57
-
58
-
59
-
60
-
61
-
62
-
63
-
64
-
65
-
66
-
67
-
68
-
69
-
70
-
71
-
72
-
73
-
74
-
75
-
76
-
77
-
78
-
79
-
80
-
81
-
82
-
83
-
84
-
85
-
86
-
87
-
88
-
89
-
90
-
91
-
92
-
93
-
94
-
95
-
96
-
97
-
98
-
99
-
100
-
101
-
102
-
103
-
104
-
105
-
106
-
107
-
108
-
109
-
110
-
111
-
112
-
113
-
114
-
115
-
116
-
117
-
118
-
119
-
120
-
121
-
122
-
123
-
124
-
125
-
126
-
127
-
128
-
129
-
130
-
131
-
132
-
133
-
134
-
135
-
136
-
137
-
138
-
139
-
140
-
141
-
142
-
143
-
144
-
 145
145 -
 146
146 -
 147
147 -
 148
148 -
 149
149 -
 150
150 -
 151
151 -
 152
152 -
 153
153 -
 154
154 -
 155
155 -
 156
156 -
 157
157 -
 158
158 -
 159
159 -
 160
160 -
 161
161 -
 162
162 -
 163
163 -
 164
164 -
 165
165 -
166
-
167
-
168
-
169
-
170
-
171
-
172
-
173
-
174
-
175
-
176
-
177
-
178
-
179
-
180
-
181
-
182
-
183
-
184
-
185
-
186
-
187
-
188
-
189
-
190
-
191
-
192
-
193
-
194
-
195
-
196
-
197
-
198
-
199
-
200
-
201
-
202
-
203
-
204
-
205
-
206
-
207
-
208
-
209
-
210
-
211
-
212
-
213
-
214
-
215
-
216
-
217
-
218
-
219
-
220
-
221
-
222
-
223
-
224
-
225
-
226
-
227
-
228
-
229
-
230
-
231
-
232
-
233
-
234
-
235
-
236
-
237
-
238
-
239
-
240
-
241
-
242
-
243
 |
 |

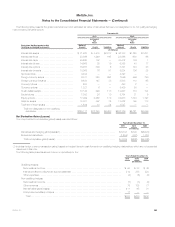
MetLife, Inc.
Notes to the Consolidated Financial Statements — (Continued)
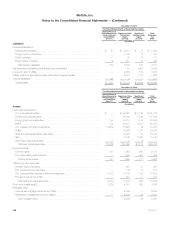
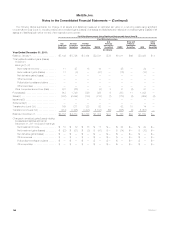
5. Fair Value
Considerable judgment is often required in interpreting market data to develop estimates of fair value, and the use of different assumptions or
valuation methodologies may have a material effect on the estimated fair value amounts.
Assets and Liabilities Measured at Fair Value
Recurring Fair Value Measurements
The assets and liabilities measured at estimated fair value on a recurring basis, including those items for which the Company has elected the FVO,
were determined as described below. These estimated fair values and their corresponding placement in the fair value hierarchy are summarized as
follows: December 31, 2011
Fair Value Measurements at Reporting Date Using
Quoted Prices in
Active Markets for
Identical Assets
and Liabilities
(Level 1)
Significant Other
Observable
Inputs
(Level 2)
Significant
Unobservable
Inputs
(Level 3)
Total
Estimated
Fair
Value
(In millions)
Assets
Fixed maturity securities:
U.S. corporate securities ................................................... $ — $ 99,001 $ 6,784 $105,785
Foreign corporate securities ................................................ — 59,648 4,370 64,018
Foreign government securities ............................................... 76 50,138 2,322 52,536
RMBS ................................................................. — 41,035 1,602 42,637
U.S. Treasury and agency securities .......................................... 19,911 20,070 31 40,012
CMBS ................................................................. — 18,316 753 19,069
State and political subdivision securities ....................................... — 13,182 53 13,235
ABS ................................................................... — 11,129 1,850 12,979
Other fixed maturity securities ............................................... — — — —
Total fixed maturity securities .............................................. 19,987 312,519 17,765 350,271
Equity securities:
Common stock .......................................................... 819 1,105 281 2,205
Non-redeemable preferred stock ............................................. — 380 438 818
Total equity securities .................................................... 819 1,485 719 3,023
Trading and other securities:
Actively Traded Securities .................................................. — 473 — 473
FVO general account securities .............................................. — 244 23 267
FVO contractholder-directed unit-linked investments ............................. 7,572 8,453 1,386 17,411
FVO securities held by CSEs ................................................ — 117 — 117
Total trading and other securities ........................................... 7,572 9,287 1,409 18,268
Short-term investments(1) .................................................... 8,150 8,120 590 16,860
Mortgage loans:
Commercial mortgage loans held by CSEs ..................................... — 3,138 — 3,138
Mortgage loans held-for-sale:(2)
Residential mortgage loans ............................................... — 2,836 228 3,064
Securitized reverse residential mortgage loans ................................ — 6,466 1,186 7,652
Total mortgage loans held-for-sale ........................................ — 9,302 1,414 10,716
Total mortgage loans ................................................ — 12,440 1,414 13,854
Other invested assets:
MSRs .................................................................. — — 666 666
Other investments ........................................................ 312 124 — 436
Derivative assets:(3)
Interest rate contracts ................................................... 32 10,426 338 10,796
Foreign currency contracts ............................................... 1 1,316 61 1,378
Credit contracts ........................................................ — 301 29 330
Equity market contracts .................................................. 29 2,703 964 3,696
Total derivative assets ................................................. 62 14,746 1,392 16,200
Total other invested assets ............................................ 374 14,870 2,058 17,302
Net embedded derivatives within asset host contracts(4) ............................ — 1 362 363
Separate account assets(5) .................................................. 28,191 173,507 1,325 203,023
Total assets ............................................................. $65,093 $532,229 $25,642 $622,964
MetLife, Inc. 151