MetLife 2011 Annual Report Download - page 180
Download and view the complete annual report
Please find page 180 of the 2011 MetLife annual report below. You can navigate through the pages in the report by either clicking on the pages listed below, or by using the keyword search tool below to find specific information within the annual report.-
 1
1 -
2
-
3
-
4
-
5
-
6
-
7
-
8
-
9
-
10
-
11
-
12
-
13
-
14
-
15
-
16
-
17
-
18
-
19
-
20
-
21
-
22
-
23
-
24
-
25
-
26
-
27
-
28
-
29
-
30
-
31
-
32
-
33
-
34
-
35
-
36
-
37
-
38
-
39
-
40
-
41
-
42
-
43
-
44
-
45
-
46
-
47
-
48
-
49
-
50
-
51
-
52
-
53
-
54
-
55
-
56
-
57
-
58
-
59
-
60
-
61
-
62
-
63
-
64
-
65
-
66
-
67
-
68
-
69
-
70
-
71
-
72
-
73
-
74
-
75
-
76
-
77
-
78
-
79
-
80
-
81
-
82
-
83
-
84
-
85
-
86
-
87
-
88
-
89
-
90
-
91
-
92
-
93
-
94
-
95
-
96
-
97
-
98
-
99
-
100
-
101
-
102
-
103
-
104
-
105
-
106
-
107
-
108
-
109
-
110
-
111
-
112
-
113
-
114
-
115
-
116
-
117
-
118
-
119
-
120
-
121
-
122
-
123
-
124
-
125
-
126
-
127
-
128
-
129
-
130
-
131
-
132
-
133
-
134
-
135
-
136
-
137
-
138
-
139
-
140
-
141
-
142
-
143
-
144
-
145
-
146
-
147
-
148
-
149
-
150
-
151
-
152
-
153
-
154
-
155
-
156
-
157
-
158
-
159
-
160
-
161
-
162
-
163
-
164
-
165
-
166
-
167
-
168
-
169
-
 170
170 -
 171
171 -
 172
172 -
 173
173 -
 174
174 -
 175
175 -
 176
176 -
 177
177 -
 178
178 -
 179
179 -
 180
180 -
 181
181 -
 182
182 -
 183
183 -
 184
184 -
 185
185 -
 186
186 -
 187
187 -
 188
188 -
 189
189 -
 190
190 -
191
-
192
-
193
-
194
-
195
-
196
-
197
-
198
-
199
-
200
-
201
-
202
-
203
-
204
-
205
-
206
-
207
-
208
-
209
-
210
-
211
-
212
-
213
-
214
-
215
-
216
-
217
-
218
-
219
-
220
-
221
-
222
-
223
-
224
-
225
-
226
-
227
-
228
-
229
-
230
-
231
-
232
-
233
-
234
-
235
-
236
-
237
-
238
-
239
-
240
-
241
-
242
-
243
 |
 |

MetLife, Inc.
Notes to the Consolidated Financial Statements — (Continued)
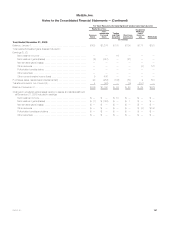
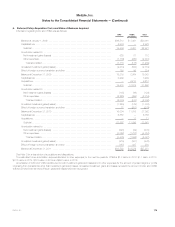
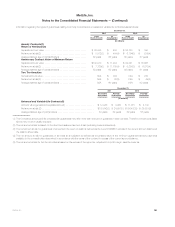
Information regarding DAC and VOBA by segment was as follows:
DAC VOBA Total
December 31,
2011 2010 2011 2010 2011 2010
(In millions)
U.S. Business:
Insurance Products ........................... $ 8,228 $ 8,247 $ 381 $ 833 $ 8,609 $ 9,080
Retirement Products .......................... 4,659 4,706 830 1,094 5,489 5,800
Corporate Benefit Funding ..................... 101 74 3 1 104 75
Auto & Home ................................ 194 190 — — 194 190
Total U.S. Business ......................... 13,182 13,217 1,214 1,928 14,396 15,145
International:
Japan ..................................... 1,989 135 6,509 6,853 8,498 6,988
Other International Regions ..................... 3,420 2,650 1,655 2,306 5,075 4,956
Total International ........................... 5,409 2,785 8,164 9,159 13,573 11,944
Corporate & Other .............................. 1 2 1123
Total .................................... $18,592 $16,004 $9,379 $11,088 $27,971 $27,092
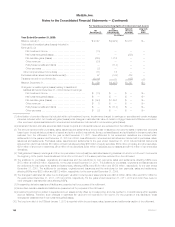
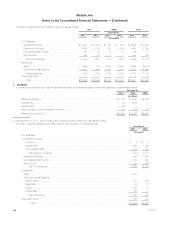
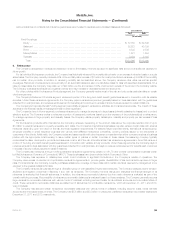
7. Goodwill
Goodwill is the excess of cost over the estimated fair value of net assets acquired. Information regarding goodwill was as follows:
December 31,
2011 2010 2009
(In millions)
Balance at January 1, .......................................................... $11,781 $ 5,047 $5,008
Acquisitions .................................................................. 39 6,959 —
Impairments(1) ................................................................ (65) — —
Effect of foreign currency translation and other ....................................... 180 (225) 39
Balance at December 31, ....................................................... $11,935 $11,781 $5,047
(1) At December 31, 2011, the Company’s accumulated goodwill impairment loss was $65 million.
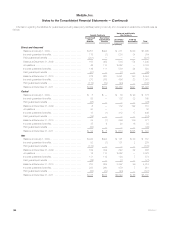
Information regarding allocated goodwill by segment and reporting unit was as follows:
December 31,
2011 2010
(In millions)
U.S. Business:
Insurance Products:
Group life .......................................................................... $ 2 $ 2
Individual life ........................................................................ 1,263 1,263
Non-medical health ................................................................... 149 149
Total Insurance Products ............................................................. 1,414 1,414
Retirement Products .................................................................... 1,692 1,692
Corporate Benefit Funding ............................................................... 900 900
Auto & Home ......................................................................... 157 157
Total U.S. Business ................................................................. 4,163 4,163
International:
Japan ............................................................................... 5,371 —
Other International Regions: ..............................................................
Latin America ....................................................................... 501 229
Asia Pacific ......................................................................... 72 72
Europe ............................................................................ 938 38
Middle East ......................................................................... 485 —
Total International .................................................................. 7,367 339
Corporate & Other ....................................................................... 405 470
Total .......................................................................... $11,935 $4,972
176 MetLife, Inc.