MetLife 2011 Annual Report Download - page 30
Download and view the complete annual report
Please find page 30 of the 2011 MetLife annual report below. You can navigate through the pages in the report by either clicking on the pages listed below, or by using the keyword search tool below to find specific information within the annual report.-
 1
1 -
2
-
3
-
4
-
5
-
6
-
7
-
8
-
9
-
10
-
11
-
12
-
13
-
14
-
15
-
16
-
17
-
18
-
19
-
 20
20 -
 21
21 -
 22
22 -
 23
23 -
 24
24 -
 25
25 -
 26
26 -
 27
27 -
 28
28 -
 29
29 -
 30
30 -
 31
31 -
 32
32 -
 33
33 -
 34
34 -
 35
35 -
 36
36 -
 37
37 -
 38
38 -
 39
39 -
 40
40 -
41
-
42
-
43
-
44
-
45
-
46
-
47
-
48
-
49
-
50
-
51
-
52
-
53
-
54
-
55
-
56
-
57
-
58
-
59
-
60
-
61
-
62
-
63
-
64
-
65
-
66
-
67
-
68
-
69
-
70
-
71
-
72
-
73
-
74
-
75
-
76
-
77
-
78
-
79
-
80
-
81
-
82
-
83
-
84
-
85
-
86
-
87
-
88
-
89
-
90
-
91
-
92
-
93
-
94
-
95
-
96
-
97
-
98
-
99
-
100
-
101
-
102
-
103
-
104
-
105
-
106
-
107
-
108
-
109
-
110
-
111
-
112
-
113
-
114
-
115
-
116
-
117
-
118
-
119
-
120
-
121
-
122
-
123
-
124
-
125
-
126
-
127
-
128
-
129
-
130
-
131
-
132
-
133
-
134
-
135
-
136
-
137
-
138
-
139
-
140
-
141
-
142
-
143
-
144
-
145
-
146
-
147
-
148
-
149
-
150
-
151
-
152
-
153
-
154
-
155
-
156
-
157
-
158
-
159
-
160
-
161
-
162
-
163
-
164
-
165
-
166
-
167
-
168
-
169
-
170
-
171
-
172
-
173
-
174
-
175
-
176
-
177
-
178
-
179
-
180
-
181
-
182
-
183
-
184
-
185
-
186
-
187
-
188
-
189
-
190
-
191
-
192
-
193
-
194
-
195
-
196
-
197
-
198
-
199
-
200
-
201
-
202
-
203
-
204
-
205
-
206
-
207
-
208
-
209
-
210
-
211
-
212
-
213
-
214
-
215
-
216
-
217
-
218
-
219
-
220
-
221
-
222
-
223
-
224
-
225
-
226
-
227
-
228
-
229
-
230
-
231
-
232
-
233
-
234
-
235
-
236
-
237
-
238
-
239
-
240
-
241
-
242
-
243
 |
 |

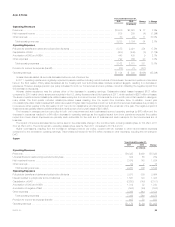
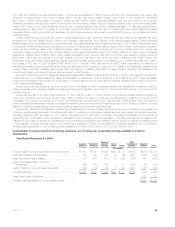
Unless otherwise stated, all amounts discussed below are net of income tax.
Our Japan operation is comprised of the Japanese business acquired in the Acquisition and remains among the largest foreign life insurers in Japan.
The stability of this business is evidenced by a solvency margin ratio significantly in excess of the legally mandated solvency margin in Japan and above
average with respect to the industry. Through our Japan operation, we provide accident and health insurance, life insurance, annuities and endowment
products to both individuals and groups. Japan’s operating earnings for 2010 include one month of results from the ALICO operations.
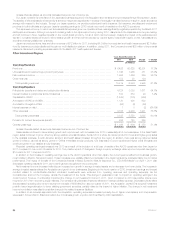
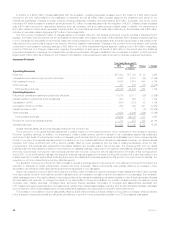
The Japanese economy, to which we face substantial exposure given our operations there, was significantly negatively impacted by the March 2011
earthquake and tsunami. Although we expect modest growth in the Japanese economy during 2012, disruptions to the Japanese economy are having,
and will continue to have, negative impacts on the overall global economy, not all of which can be foreseen. Despite the impact of the earthquake and
tsunami, our sales results continued to show steady growth and improvement across our captive agent, independent agent, broker, bancassurance,
and direct marketing distribution channels.
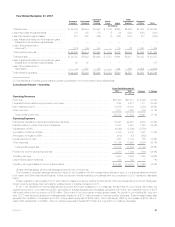
Japan reported premiums, fees and other revenues of $7.2 billion for 2011, including $4.3 billion from accident and health insurance and $2.7 billion
from life insurance products distributed through our multi-distribution platform. In addition, during 2011, the Company incurred $39 million of incremental
insurance claims and operating expenses related to the March 2011 earthquake and tsunami.
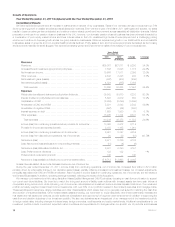
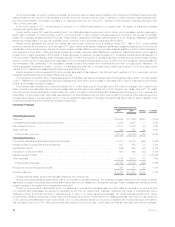
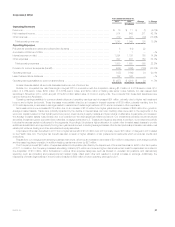
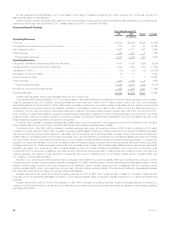
Other International Regions
Years Ended December 31,
2011 2010 Change % Change
(In millions)
Operating Revenues
Premiums .......................................................................... $ 6,426 $3,625 $2,801 77.3%
Universal life and investment-type product policy fees ....................................... 1,746 1,265 481 38.0%
Net investment income ............................................................... 1,995 1,466 529 36.1%
Other revenues ..................................................................... 152 28 124
Total operating revenues ............................................................ 10,319 6,384 3,935 61.6%
Operating Expenses
Policyholder benefits and claims and policyholder dividends .................................. 4,724 3,053 1,671 54.7%
Interest credited to policyholder account balances .......................................... 583 554 29 5.2%
Capitalization of DAC ................................................................. (1,643) (775) (868)
Amortization of DAC and VOBA ......................................................... 1,120 490 630
Amortization of negative VOBA ......................................................... (64) (8) (56)
Interest expense on debt .............................................................. 1 3 (2) (66.7)%
Other expenses ..................................................................... 4,164 2,233 1,931 86.5%
Total operating expenses ............................................................ 8,885 5,550 3,335 60.1%
Provision for income tax expense (benefit) ................................................. 398 148 250
Operating earnings .................................................................. $ 1,036 $ 686 $ 350 51.0%
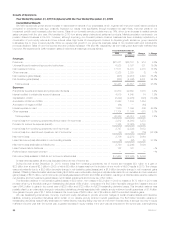
Unless otherwise stated, all amounts discussed below are net of income tax.
Sales results continued to show steady growth and improvement, with increases over 2010 in essentially all of our businesses. In the Asia Pacific
region, sales continued to grow, driven by strong variable universal life sales, the launch of a whole life cancer product in Korea and higher group sales
in the Australia business. In Latin America, accident and health sales increased throughout the region. In addition, there was strong retirement sales
growth in Mexico, as well as strong growth in Chile’s immediate annuity products. Our business in Europe experienced higher credit life sales and
continued growth in our variable annuity business.
Reported operating earnings increased over 2010 as a result of the inclusion of a full year of results of the ALICO operations other than Japan for
2011 compared to one month of results for 2010. The positive impact of changes in foreign currency exchange rates improved reported earnings by
$19 million for 2011 compared to 2010.
In addition to the increase in operating earnings due to the ALICO operations other than Japan, the current year benefited from business growth,
most notably in Mexico, Korea and Ireland. These increases were partially offset by a decrease in the Japan reinsurance business mainly due to market
performance. The impact of the sale of the Company’s interest in Mitsui Sumitomo MetLife Insurance Co., LTD (“MSI MetLife”) on April 1, 2011 also
decreased operating results for 2011, as no earnings were recognized in the current year.
Net investment income increased reflecting an increase from growth in average invested assets and a decrease from lower yields. The increase in
average invested assets reflects the Acquisition and growth in our businesses. Beginning in the fourth quarter of 2010, investment earnings and interest
credited related to contractholder-directed unit-linked investments were excluded from operating revenues and operating expenses, as the
contractholder, and not the Company, directs the investment of the funds. This change in presentation had no impact on operating earnings in the
current period; however, it unfavorably impacted the change in net investment income in 2011, when compared to 2010 as positive returns were
incurred in 2010 from recovering equity markets. The corresponding favorable impact is reflected in interest credited expense. Decreased yields reflect
the decreased operating joint venture returns from the sale of MSI MetLife in second quarter of 2011, the Acquisition, as ALICO’s acquired investment
portfolio has a larger allocation to lower yielding government securities, partially offset by the impact of higher inflation. The change in net investment
income from inflation was offset by a similar change in the related insurance liabilities.
In addition to an increase associated with the Acquisition, operating expenses increased primarily due to higher commissions and compensation
expenses in Korea, Mexico, Brazil and Ireland due to business growth, a portion which is offset by DAC capitalization.
26 MetLife, Inc.