MetLife 2011 Annual Report Download - page 136
Download and view the complete annual report
Please find page 136 of the 2011 MetLife annual report below. You can navigate through the pages in the report by either clicking on the pages listed below, or by using the keyword search tool below to find specific information within the annual report.-
 1
1 -
2
-
3
-
4
-
5
-
6
-
7
-
8
-
9
-
10
-
11
-
12
-
13
-
14
-
15
-
16
-
17
-
18
-
19
-
20
-
21
-
22
-
23
-
24
-
25
-
26
-
27
-
28
-
29
-
30
-
31
-
32
-
33
-
34
-
35
-
36
-
37
-
38
-
39
-
40
-
41
-
42
-
43
-
44
-
45
-
46
-
47
-
48
-
49
-
50
-
51
-
52
-
53
-
54
-
55
-
56
-
57
-
58
-
59
-
60
-
61
-
62
-
63
-
64
-
65
-
66
-
67
-
68
-
69
-
70
-
71
-
72
-
73
-
74
-
75
-
76
-
77
-
78
-
79
-
80
-
81
-
82
-
83
-
84
-
85
-
86
-
87
-
88
-
89
-
90
-
91
-
92
-
93
-
94
-
95
-
96
-
97
-
98
-
99
-
100
-
101
-
102
-
103
-
104
-
105
-
106
-
107
-
108
-
109
-
110
-
111
-
112
-
113
-
114
-
115
-
116
-
117
-
118
-
119
-
120
-
121
-
122
-
123
-
124
-
125
-
 126
126 -
 127
127 -
 128
128 -
 129
129 -
 130
130 -
 131
131 -
 132
132 -
 133
133 -
 134
134 -
 135
135 -
 136
136 -
 137
137 -
 138
138 -
 139
139 -
 140
140 -
 141
141 -
 142
142 -
 143
143 -
 144
144 -
 145
145 -
 146
146 -
147
-
148
-
149
-
150
-
151
-
152
-
153
-
154
-
155
-
156
-
157
-
158
-
159
-
160
-
161
-
162
-
163
-
164
-
165
-
166
-
167
-
168
-
169
-
170
-
171
-
172
-
173
-
174
-
175
-
176
-
177
-
178
-
179
-
180
-
181
-
182
-
183
-
184
-
185
-
186
-
187
-
188
-
189
-
190
-
191
-
192
-
193
-
194
-
195
-
196
-
197
-
198
-
199
-
200
-
201
-
202
-
203
-
204
-
205
-
206
-
207
-
208
-
209
-
210
-
211
-
212
-
213
-
214
-
215
-
216
-
217
-
218
-
219
-
220
-
221
-
222
-
223
-
224
-
225
-
226
-
227
-
228
-
229
-
230
-
231
-
232
-
233
-
234
-
235
-
236
-
237
-
238
-
239
-
240
-
241
-
242
-
243
 |
 |

MetLife, Inc.
Notes to the Consolidated Financial Statements — (Continued)
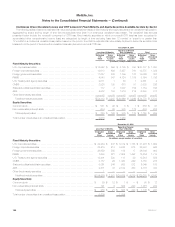
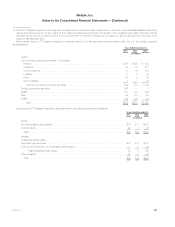
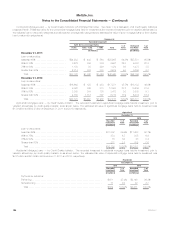
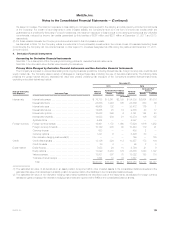
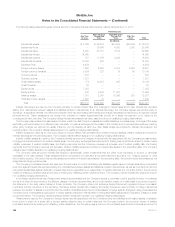
Commercial Mortgage Loans — by Credit Quality Indicators with Estimated Fair Value. See Note 1 for a discussion of all credit quality indicators
presented herein. Presented below for the commercial mortgage loans held-for-investment is the recorded investment, prior to valuation allowances, by
the indicated loan-to-value ratio categories and debt service coverage ratio categories and estimated fair value of such mortgage loans by the indicated
loan-to-value ratio categories at:
Commercial
Recorded Investment
Estimated
Fair Value %of
Total
Debt Service Coverage Ratios
Total %of
Total>1.20x 1.00x - 1.20x < 1.00x
(In millions) (In millions)
December 31, 2011:
Loan-to-value ratios:
Less than 65% ........................ $24,983 $ 448 $ 564 $25,995 64.3% $27,581 65.5%
65%to75% .......................... 8,275 336 386 8,997 22.3 9,387 22.3
76%to80% .......................... 1,150 98 226 1,474 3.6 1,473 3.5
Greater than 80% ...................... 2,714 880 380 3,974 9.8 3,664 8.7
Total ............................... $37,122 $1,762 $1,556 $40,440 100.0% $42,105 100.0%
December 31, 2010:
Loan-to-value ratios:
Less than 65% ........................ $16,663 $ 125 $ 483 $17,271 45.7% $18,183 46.9%
65%to75% .......................... 9,022 765 513 10,300 27.2 10,685 27.6
76%to80% .......................... 3,033 304 135 3,472 9.2 3,535 9.1
Greater than 80% ...................... 4,155 1,813 807 6,775 17.9 6,374 16.4
Total ............................... $32,873 $3,007 $1,938 $37,818 100.0% $38,777 100.0%
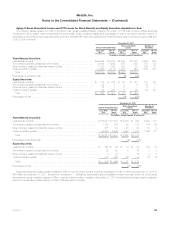
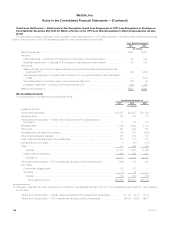
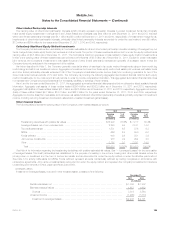
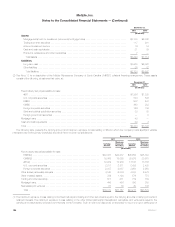
Agricultural Mortgage Loans — by Credit Quality Indicator. The recorded investment in agricultural mortgage loans held-for-investment, prior to
valuation allowances, by credit quality indicator, is as shown below. The estimated fair value of agricultural mortgage loans held-for-investment was
$13.6 billion and $12.9 billion at December 31, 2011 and 2010, respectively.
Agricultural
December 31,
2011 2010
Recorded
Investment %of
Total Recorded
Investment %of
Total
(In millions) (In millions)
Loan-to-value ratios:
Less than 65% ....................................................... $11,802 89.9% $11,483 90.1%
65%to75%......................................................... 874 6.7 885 6.9
76%to80%......................................................... 76 0.6 48 0.4
Greater than 80% .................................................... 377 2.8 335 2.6
Total ............................................................. $13,129 100.0% $12,751 100.0%
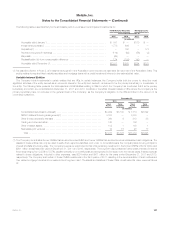
Residential Mortgage Loans — by Credit Quality Indicator. The recorded investment in residential mortgage loans held-for-investment, prior to
valuation allowances, by credit quality indicator, is as shown below. The estimated fair value of residential mortgage loans held-for-investment was
$737 million and $2.3 billion at December 31, 2011 and 2010, respectively.
Residential
December 31,
2011 2010
Recorded
Investment %of
Total Recorded
Investment %of
Total
(In millions) (In millions)
Performance indicators:
Performing .......................................................... $671 97.4% $2,149 96.3%
Nonperforming ....................................................... 18 2.6 82 3.7
Total ............................................................. $689 100.0% $2,231 100.0%
132 MetLife, Inc.