MetLife 2011 Annual Report Download - page 59
Download and view the complete annual report
Please find page 59 of the 2011 MetLife annual report below. You can navigate through the pages in the report by either clicking on the pages listed below, or by using the keyword search tool below to find specific information within the annual report.-
 1
1 -
2
-
3
-
4
-
5
-
6
-
7
-
8
-
9
-
10
-
11
-
12
-
13
-
14
-
15
-
16
-
17
-
18
-
19
-
20
-
21
-
22
-
23
-
24
-
25
-
26
-
27
-
28
-
29
-
30
-
31
-
32
-
33
-
34
-
35
-
36
-
37
-
38
-
39
-
40
-
41
-
42
-
43
-
44
-
45
-
46
-
47
-
48
-
 49
49 -
 50
50 -
 51
51 -
 52
52 -
 53
53 -
 54
54 -
 55
55 -
 56
56 -
 57
57 -
 58
58 -
 59
59 -
 60
60 -
 61
61 -
 62
62 -
 63
63 -
 64
64 -
 65
65 -
 66
66 -
 67
67 -
 68
68 -
 69
69 -
70
-
71
-
72
-
73
-
74
-
75
-
76
-
77
-
78
-
79
-
80
-
81
-
82
-
83
-
84
-
85
-
86
-
87
-
88
-
89
-
90
-
91
-
92
-
93
-
94
-
95
-
96
-
97
-
98
-
99
-
100
-
101
-
102
-
103
-
104
-
105
-
106
-
107
-
108
-
109
-
110
-
111
-
112
-
113
-
114
-
115
-
116
-
117
-
118
-
119
-
120
-
121
-
122
-
123
-
124
-
125
-
126
-
127
-
128
-
129
-
130
-
131
-
132
-
133
-
134
-
135
-
136
-
137
-
138
-
139
-
140
-
141
-
142
-
143
-
144
-
145
-
146
-
147
-
148
-
149
-
150
-
151
-
152
-
153
-
154
-
155
-
156
-
157
-
158
-
159
-
160
-
161
-
162
-
163
-
164
-
165
-
166
-
167
-
168
-
169
-
170
-
171
-
172
-
173
-
174
-
175
-
176
-
177
-
178
-
179
-
180
-
181
-
182
-
183
-
184
-
185
-
186
-
187
-
188
-
189
-
190
-
191
-
192
-
193
-
194
-
195
-
196
-
197
-
198
-
199
-
200
-
201
-
202
-
203
-
204
-
205
-
206
-
207
-
208
-
209
-
210
-
211
-
212
-
213
-
214
-
215
-
216
-
217
-
218
-
219
-
220
-
221
-
222
-
223
-
224
-
225
-
226
-
227
-
228
-
229
-
230
-
231
-
232
-
233
-
234
-
235
-
236
-
237
-
238
-
239
-
240
-
241
-
242
-
243
 |
 |

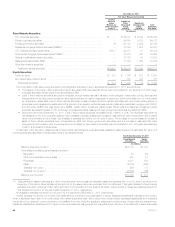
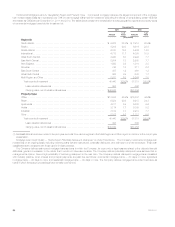
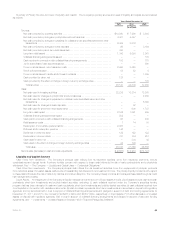
The following table presents the recorded investment and valuation allowance for all mortgage loans held-for-investment distributed by the above
stated loan classifications at:
December 31,
2011 2010
Recorded
Investment %of
Total Valuation
Allowance
%of
Recorded
Investment Recorded
Investment %of
Total Valuation
Allowance
%of
Recorded
Investment
(In millions)
Commercial:
Performing ...................................... $40,106 99.1% $339 0.8% $37,487 99.1% $528 1.4%
Restructured(1) .................................. 248 0.6 44 17.7% 93 0.2 6 6.5%
Potentially delinquent .............................. 23 0.1 15 65.2% 180 0.5 28 15.6%
Delinquent or under foreclosure ...................... 63 0.2 — —% 58 0.2 — —%
Total ......................................... $40,440 100.0% $398 1.0% $37,818 100.0% $562 1.5%
Agricultural(2):
Performing ...................................... $12,899 98.3% $ 41 0.3% $12,486 97.9% $ 35 0.3%
Restructured(3) .................................. 58 0.4 7 12.1% 33 0.3 8 24.2%
Potentially delinquent .............................. 25 0.2 4 16.0% 62 0.5 11 17.7%
Delinquent or under foreclosure(3) .................... 147 1.1 29 19.7% 170 1.3 34 20.0%
Total ......................................... $13,129 100.0% $ 81 0.6% $12,751 100.0% $ 88 0.7%
Residential(4):
Performing ...................................... $ 664 96.4% $ 1 0.2% $ 2,145 96.1% $ 12 0.6%
Restructured(5) .................................. — — — —% 4 0.2 — —%
Potentially delinquent .............................. — — — —% 4 0.2 — —%
Delinquent or under foreclosure(5) .................... 25 3.6 1 4.0% 78 3.5 2 2.6%
Total(6) ....................................... $ 689 100.0% $ 2 0.3% $ 2,231 100.0% $ 14 0.6%
(1) As of December 31, 2011 and 2010, restructured commercial mortgage loans were comprised of 10 and five restructured loans, respectively, all of
which were performing.
(2) Of the $13.1 billion of agricultural mortgage loans outstanding at December 31, 2011, 50% were subject to rate resets prior to maturity. A substantial
portion of these mortgage loans have been successfully reset, refinanced or extended at market terms.
(3) As of December 31, 2011 and 2010, restructured agricultural mortgage loans were comprised of 11 and five restructured loans, respectively, all of
which were performing. Additionally, as of December 31, 2011 and 2010, delinquent or under foreclosure agricultural mortgage loans included four
and two restructured loans with a recorded investment of $13 million and $29 million, respectively, which were not performing.
(4) Residential mortgage loans held-for-investment consist primarily of first lien residential mortgage loans and, to a much lesser extent, second lien
residential mortgage loans and home equity lines of credit.
(5) There were no restructured residential mortgage loans at December 31, 2011. As of December 31, 2010, restructured residential mortgage loans
were comprised of 12 restructured loans, all of which were performing.
(6) The valuation allowance on and the related carrying value of certain residential mortgage loans held-for-investment was transferred to held-for-sale in
connection with the pending disposition of certain operations of MetLife Bank. See Note 2 of the Notes to the Consolidated Financial Statements.
See Note 3 of the Notes to the Consolidated Financial Statements for tables that present, by portfolio segment, mortgage loans by credit quality
indicator, impaired mortgage loans, past due and nonaccrual mortgage loans, as well as loans modified through troubled debt restructurings.
Mortgage Loan Credit Quality — Monitoring Process — Commercial and Agricultural Mortgage Loans. The Company reviews all commercial
mortgage loans on an ongoing basis. These reviews may include an analysis of the property financial statements and rent roll, lease rollover analysis,
property inspections, market analysis, estimated valuations of the underlying collateral, loan-to-value ratios, debt service coverage ratios, and tenant
creditworthiness. The monitoring process focuses on higher risk loans, which include those that are classified as restructured, potentially delinquent,
delinquent or in foreclosure, as well as loans with higher loan-to-value ratios and lower debt service coverage ratios. The monitoring process for
agricultural mortgage loans is generally similar, with a focus on higher risk loans, such as loans with higher loan-to-value ratios, including reviews on a
geographic and property type basis.
Loan-to-value ratios and debt service coverage ratios are common measures in the assessment of the quality of commercial mortgage loans.
Loan-to-value ratios are a common measure in the assessment of the quality of agricultural mortgage loans. Loan-to-value ratios compare the amount of
the loan to the estimated fair value of the underlying collateral. A loan-to-value ratio greater than 100% indicates that the loan amount is greater than the
collateral value. A loan-to-value ratio of less than 100% indicates an excess of collateral value over the loan amount. The debt service coverage ratio
compares a property’s net operating income to amounts needed to service the principal and interest due under the loan. For commercial mortgage
loans, the average loan-to-value ratio was 61% and 66% at December 31, 2011 and 2010, respectively, and the average debt service coverage ratio
was 2.1x at December 31, 2011, as compared to 2.4x at December 31, 2010. The commercial mortgage loan debt service coverage ratio and
loan-to-value ratio, as well as the values utilized in calculating these ratios, are updated annually, on a rolling basis, with a portion of the commercial
mortgage loan portfolio updated each quarter. For agricultural mortgage loans, the average loan-to-value ratio was 48% and 49% at December 31,
2011 and 2010, respectively. The values utilized in calculating the agricultural mortgage loan loan-to-value ratio are developed in connection with the
ongoing review of the agricultural loan portfolio and are routinely updated.
MetLife, Inc. 55