MetLife 2011 Annual Report Download - page 210
Download and view the complete annual report
Please find page 210 of the 2011 MetLife annual report below. You can navigate through the pages in the report by either clicking on the pages listed below, or by using the keyword search tool below to find specific information within the annual report.-
 1
1 -
2
-
3
-
4
-
5
-
6
-
7
-
8
-
9
-
10
-
11
-
12
-
13
-
14
-
15
-
16
-
17
-
18
-
19
-
20
-
21
-
22
-
23
-
24
-
25
-
26
-
27
-
28
-
29
-
30
-
31
-
32
-
33
-
34
-
35
-
36
-
37
-
38
-
39
-
40
-
41
-
42
-
43
-
44
-
45
-
46
-
47
-
48
-
49
-
50
-
51
-
52
-
53
-
54
-
55
-
56
-
57
-
58
-
59
-
60
-
61
-
62
-
63
-
64
-
65
-
66
-
67
-
68
-
69
-
70
-
71
-
72
-
73
-
74
-
75
-
76
-
77
-
78
-
79
-
80
-
81
-
82
-
83
-
84
-
85
-
86
-
87
-
88
-
89
-
90
-
91
-
92
-
93
-
94
-
95
-
96
-
97
-
98
-
99
-
100
-
101
-
102
-
103
-
104
-
105
-
106
-
107
-
108
-
109
-
110
-
111
-
112
-
113
-
114
-
115
-
116
-
117
-
118
-
119
-
120
-
121
-
122
-
123
-
124
-
125
-
126
-
127
-
128
-
129
-
130
-
131
-
132
-
133
-
134
-
135
-
136
-
137
-
138
-
139
-
140
-
141
-
142
-
143
-
144
-
145
-
146
-
147
-
148
-
149
-
150
-
151
-
152
-
153
-
154
-
155
-
156
-
157
-
158
-
159
-
160
-
161
-
162
-
163
-
164
-
165
-
166
-
167
-
168
-
169
-
170
-
171
-
172
-
173
-
174
-
175
-
176
-
177
-
178
-
179
-
180
-
181
-
182
-
183
-
184
-
185
-
186
-
187
-
188
-
189
-
190
-
191
-
192
-
193
-
194
-
195
-
196
-
197
-
198
-
199
-
 200
200 -
 201
201 -
 202
202 -
 203
203 -
 204
204 -
 205
205 -
 206
206 -
 207
207 -
 208
208 -
 209
209 -
 210
210 -
 211
211 -
 212
212 -
 213
213 -
 214
214 -
 215
215 -
 216
216 -
 217
217 -
 218
218 -
 219
219 -
 220
220 -
221
-
222
-
223
-
224
-
225
-
226
-
227
-
228
-
229
-
230
-
231
-
232
-
233
-
234
-
235
-
236
-
237
-
238
-
239
-
240
-
241
-
242
-
243
 |
 |

MetLife, Inc.
Notes to the Consolidated Financial Statements — (Continued)
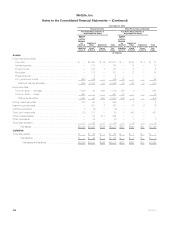
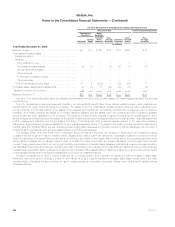
The components of net periodic benefit costs and other changes in plan assets and benefit obligations recognized in other comprehensive income
(loss) were as follows:
Pension Benefits Other Postretirement Benefits
U.S. Plans Non-U.S. Plans U.S. Plans Non-U.S. Plans
Years Ended December 31,
2011 2010 2009 2011 2010 2009 2011 2010 2009 2011 2010 2009
(In millions)
Net Periodic Benefit Costs:
Service costs ............................ $187 $172 $170 $ 64 $ 8 $— $ 16 $ 16 $ 22 $ 1 $ 1 $—
Interest costs ............................. 404 393 395 16 6 — 106 111 125 2 2 —
Settlement and curtailment costs ............. — — 17 — 8 — — — — 1 1 —
Expected return on plan assets .............. (448) (444) (439) (6) (6) — (76) (79) (72) (1) — —
Amortization of net actuarial (gains) losses ...... 194 196 227 — — — 43 38 42 — — —
Amortization of prior service costs (credit) ....... 4 7 10 — — — (108) (83) (36) — — —
Total net periodic benefit costs (credit) ....... 341 324 380 74 16 — (19) 3 81 3 4 —
Other Changes in Plan Assets and Benefit
Obligations Recognized in Other
Comprehensive Income (Loss):
Net actuarial (gains) losses .................. 575 37 310 34 (15) — 262 49 283 5 1 —
Prior service costs (credit) ................... 17 — (10) — 1 — — (81) (167) — 1 —
Amortization of net actuarial gains (losses) ...... (194) (196) (227) — — — (43) (38) (42) — — —
Amortization of prior service (costs) credit ....... (4) (7) (10) — — — 108 83 36 — — —
Total recognized in other comprehensive
income (loss) ......................... 394 (166) 63 34 (14) — 327 13 110 5 2 —
Total recognized in net periodic benefit costs
and other comprehensive income (loss) . . $ 735 $ 158 $ 443 $108 $ 2 $— $ 308 $ 16 $ 191 $ 8 $ 6 $—
For the year ended December 31, 2011, included within other comprehensive income (loss) were other changes in plan assets and benefit
obligations associated with pension benefits of $394 million for the U.S. plans and $34 million for the non-U.S. plans and other postretirement benefits
of $327 million for the U.S. plans and $5 million for the non-U.S. plans for an aggregate reduction in other comprehensive income (loss) of $760 million
before income tax and $494 million, net of income tax.
The estimated net actuarial (gains) losses and prior service costs (credit) for the U.S. pension plans that will be amortized from accumulated other
comprehensive income (loss) into net periodic benefit costs over the next year are $178 million and $6 million, respectively.
The estimated net actuarial (gains) losses and prior service costs (credit) for the U.S. defined benefit other postretirement benefit plans that willbe
amortized from accumulated other comprehensive income (loss) into net periodic benefit costs over the next year are $54 million and ($104) million,
respectively.
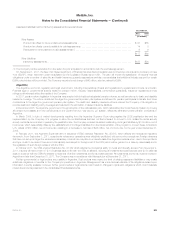
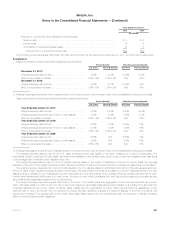
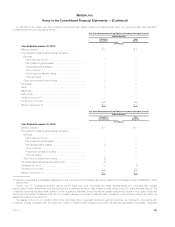
The Medicare Modernization Act of 2003 created various subsidies for all U.S. sponsors of retiree drug programs. Two common ways of providing
subsidies were the Retiree Drug Subsidy (“RDS”) and Medicare Part D Prescription Drug Plans (“PDP”). From 2006 through 2010, the Company applied
for and received the RDS each year. The RDS program provides the subsidy through cash payments made by Medicare to the Company, resulting in
smaller net claims paid by the Company. A summary of the reduction to the APBO and the related reduction to the components of net periodic other
postretirement benefits plan costs resulting from receipt of the RDS is presented below. As of January 1, 2011, as a result of changes made under the
Patient Protection and Affordable Care Act of 2010, the Company, no longer applies for the RDS. Instead it has joined PDP and will indirectly receive
Medicare subsidies in the form of smaller gross benefit payments for prescription drug coverage.
December 31,
2010 2009
(In millions)
Cumulative reduction in other postretirement benefits obligations:
Balance at January 1, ....................................................................... $247 $317
Service costs ............................................................................. 3 2
Interest costs ............................................................................. 16 16
Net actuarial (gains) losses ................................................................... (255) (76)
Expected prescription drug subsidy ............................................................ (11) (12)
Balance at December 31, ................................................................. $ — $247
206 MetLife, Inc.