MetLife 2011 Annual Report Download - page 37
Download and view the complete annual report
Please find page 37 of the 2011 MetLife annual report below. You can navigate through the pages in the report by either clicking on the pages listed below, or by using the keyword search tool below to find specific information within the annual report.-
 1
1 -
2
-
3
-
4
-
5
-
6
-
7
-
8
-
9
-
10
-
11
-
12
-
13
-
14
-
15
-
16
-
17
-
18
-
19
-
20
-
21
-
22
-
23
-
24
-
25
-
26
-
 27
27 -
 28
28 -
 29
29 -
 30
30 -
 31
31 -
 32
32 -
 33
33 -
 34
34 -
 35
35 -
 36
36 -
 37
37 -
 38
38 -
 39
39 -
 40
40 -
 41
41 -
 42
42 -
 43
43 -
 44
44 -
 45
45 -
 46
46 -
 47
47 -
48
-
49
-
50
-
51
-
52
-
53
-
54
-
55
-
56
-
57
-
58
-
59
-
60
-
61
-
62
-
63
-
64
-
65
-
66
-
67
-
68
-
69
-
70
-
71
-
72
-
73
-
74
-
75
-
76
-
77
-
78
-
79
-
80
-
81
-
82
-
83
-
84
-
85
-
86
-
87
-
88
-
89
-
90
-
91
-
92
-
93
-
94
-
95
-
96
-
97
-
98
-
99
-
100
-
101
-
102
-
103
-
104
-
105
-
106
-
107
-
108
-
109
-
110
-
111
-
112
-
113
-
114
-
115
-
116
-
117
-
118
-
119
-
120
-
121
-
122
-
123
-
124
-
125
-
126
-
127
-
128
-
129
-
130
-
131
-
132
-
133
-
134
-
135
-
136
-
137
-
138
-
139
-
140
-
141
-
142
-
143
-
144
-
145
-
146
-
147
-
148
-
149
-
150
-
151
-
152
-
153
-
154
-
155
-
156
-
157
-
158
-
159
-
160
-
161
-
162
-
163
-
164
-
165
-
166
-
167
-
168
-
169
-
170
-
171
-
172
-
173
-
174
-
175
-
176
-
177
-
178
-
179
-
180
-
181
-
182
-
183
-
184
-
185
-
186
-
187
-
188
-
189
-
190
-
191
-
192
-
193
-
194
-
195
-
196
-
197
-
198
-
199
-
200
-
201
-
202
-
203
-
204
-
205
-
206
-
207
-
208
-
209
-
210
-
211
-
212
-
213
-
214
-
215
-
216
-
217
-
218
-
219
-
220
-
221
-
222
-
223
-
224
-
225
-
226
-
227
-
228
-
229
-
230
-
231
-
232
-
233
-
234
-
235
-
236
-
237
-
238
-
239
-
240
-
241
-
242
-
243
 |
 |

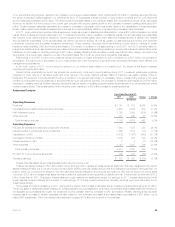
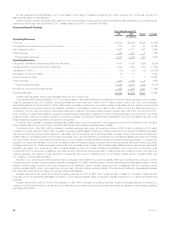
Other expenses decreased by $82 million, largely due to a decrease of $40 million from the impact of market conditions on certain expenses, such
as pension and post-retirement benefit costs. In addition, a decrease in information technology expenses of $29 million contributed to the improvement
in operating earnings. A decrease in variable expenses, such as commissions and premium taxes, further reduced expenses by $11 million, a portion of
which is offset by DAC capitalization.
The reduction in the dividend scale in the fourth quarter of 2009 resulted in a $109 million decrease in policyholder dividends in the traditional life
business in 2010.
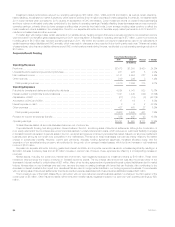
Claims experience varied amongst Insurance Products’ businesses with a net unfavorable impact of $42 million to operating earnings. We
experienced excellent mortality results in our group life business due to a decrease in severity, as well as favorable reserve refinements in 2010. In
addition, an improvement in our LTC results was driven by favorable claim experience mainly due to higher terminations and less claimants in 2010,
coupled with the impact of unfavorable reserve refinements in 2009. Our improved dental results were driven by higher enrollment and pricing actions,
as well as improved claim experience in the current year. The impact of this positive experience was surpassed by solid, but less favorable mortality, in
our individual life business combined with higher incidence and severity of group disability claims in the current year, and the impact of a gain from the
recapture of a reinsurance agreement in 2009.
Higher DAC amortization of $157 million was primarily driven by the impact of higher gross margins, a primary component in the determination of the
amount of amortization, mostly in the closed block resulting from increased investment yields and the impact of dividend scale reductions. In addition,
the net impact of various model refinements in both 2010 and 2009 increased DAC amortization.
Certain events reduced operating earnings, including the impact of a benefit being recorded in 2009 of $17 million related to the positive resolution
of certain legal matters and an increase in current income tax expense of $27 million, resulting from an increase in our effective tax rate.
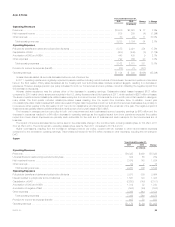
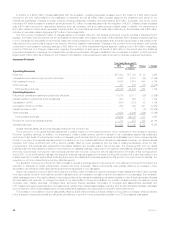
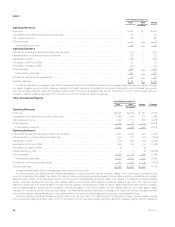
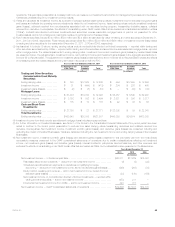
Retirement Products
Years Ended December 31,
2010 2009 Change % Change
(In millions)
Operating Revenues
Premiums .......................................................................... $ 875 $ 920 $(45) (4.9)%
Universal life and investment-type product policy fees ........................................ 2,024 1,543 481 31.2%
Net investment income ............................................................... 3,395 3,098 297 9.6%
Other revenues ..................................................................... 220 173 47 27.2%
Total operating revenues ............................................................ 6,514 5,734 780 13.6%
Operating Expenses
Policyholder benefits and claims and policyholder dividends ................................... 1,487 1,486 1 0.1%
Interest credited to policyholder account balances .......................................... 1,612 1,688 (76) (4.5)%
Capitalization of DAC ................................................................. (1,067) (1,067) — —%
Amortization of DAC and VOBA ......................................................... 808 610 198 32.5%
Interest expense on debt .............................................................. 3 — 3
Other expenses ..................................................................... 2,437 2,403 34 1.4%
Total operating expenses ............................................................ 5,280 5,120 160 3.1%
Provision for income tax expense (benefit) ................................................. 431 216 215 99.5%
Operating earnings ................................................................... $ 803 $ 398 $405
Unless otherwise stated, all amounts discussed below are net of income tax.
During 2010, overall annuity sales decreased 5% compared to 2009 as declines in fixed annuity sales were partially offset by increased sales of our
variable annuity products. The financial market turmoil in early 2009 resulted in extraordinarily high sales of fixed annuity products in 2009. The high
sales level was not expected to continue after the financial markets returned to more stable levels. Variable annuity product sales increased primarily due
to the expansion of alternative distribution channels and fewer competitors in the market place. Surrender rates for both our variable and fixed annuities
remained low during the current period as we believe our customers continue to value our products compared to other alternatives in the marketplace.
Interest rate and equity market changes were the primary driver of the $405 million increase in operating earnings, with the largest impact resulting
from a $343 million increase in policy fees and other revenues and, a $193 million increase in net investment income, offset by a $132 million increase
in DAC, VOBA and DSI amortization and a $39 million increase in commission expense resulting from growth in annuity contract balances.
A significant increase in average separate account balances was largely attributable to favorable market performance resulting from improved market
conditions since the second quarter of 2009 and positive net cash flows from the annuity business. This resulted in higher policy fees and other
revenues of $343 million, partially offset by greater DAC, VOBA and DSI amortization. Policy fees are typically calculated as a percentage of the average
assets in the separate account. DAC, VOBA and DSI amortization is based on the earnings of the business, which in the retirement business are
derived, in part, from fees earned on separate account balances.
Financial market improvements also resulted in the increase in net investment income of $193 million as a $291 million increase from higher yields
was partially offset by a $98 million decrease from a decline in average invested assets. Yields were positively impacted by the effects of the continued
repositioning of the accumulated liquidity in our investment portfolio to longer duration and higher yielding assets, including investment grade corporate
fixed maturity securities. Yields were also positively impacted by the effects of recovering private equity markets and stabilizing real estate markets on
other limited partnership interests and real estate joint ventures. Despite positive net cash flows, a reduction in the general account investment portfolio
was due to the impact of more customers gaining confidence in the equity markets and, as a result, electing to transfer funds into our separate account
investment options as market conditions improved. To manage the needs of our intermediate to longer-term liabilities, our investment portfolio consists
primarily of investment grade corporate fixed maturity securities, structured finance securities, mortgage loans and U.S. Treasury and agency securities
and, to a lesser extent, certain other invested asset classes, including other limited partnership interests, real estate joint ventures and other invested
assets, in order to provide additional diversification and opportunity for long-term yield enhancement.
MetLife, Inc. 33