MetLife 2011 Annual Report Download - page 27
Download and view the complete annual report
Please find page 27 of the 2011 MetLife annual report below. You can navigate through the pages in the report by either clicking on the pages listed below, or by using the keyword search tool below to find specific information within the annual report.-
 1
1 -
2
-
3
-
4
-
5
-
6
-
7
-
8
-
9
-
10
-
11
-
12
-
13
-
14
-
15
-
16
-
 17
17 -
 18
18 -
 19
19 -
 20
20 -
 21
21 -
 22
22 -
 23
23 -
 24
24 -
 25
25 -
 26
26 -
 27
27 -
 28
28 -
 29
29 -
 30
30 -
 31
31 -
 32
32 -
 33
33 -
 34
34 -
 35
35 -
 36
36 -
 37
37 -
38
-
39
-
40
-
41
-
42
-
43
-
44
-
45
-
46
-
47
-
48
-
49
-
50
-
51
-
52
-
53
-
54
-
55
-
56
-
57
-
58
-
59
-
60
-
61
-
62
-
63
-
64
-
65
-
66
-
67
-
68
-
69
-
70
-
71
-
72
-
73
-
74
-
75
-
76
-
77
-
78
-
79
-
80
-
81
-
82
-
83
-
84
-
85
-
86
-
87
-
88
-
89
-
90
-
91
-
92
-
93
-
94
-
95
-
96
-
97
-
98
-
99
-
100
-
101
-
102
-
103
-
104
-
105
-
106
-
107
-
108
-
109
-
110
-
111
-
112
-
113
-
114
-
115
-
116
-
117
-
118
-
119
-
120
-
121
-
122
-
123
-
124
-
125
-
126
-
127
-
128
-
129
-
130
-
131
-
132
-
133
-
134
-
135
-
136
-
137
-
138
-
139
-
140
-
141
-
142
-
143
-
144
-
145
-
146
-
147
-
148
-
149
-
150
-
151
-
152
-
153
-
154
-
155
-
156
-
157
-
158
-
159
-
160
-
161
-
162
-
163
-
164
-
165
-
166
-
167
-
168
-
169
-
170
-
171
-
172
-
173
-
174
-
175
-
176
-
177
-
178
-
179
-
180
-
181
-
182
-
183
-
184
-
185
-
186
-
187
-
188
-
189
-
190
-
191
-
192
-
193
-
194
-
195
-
196
-
197
-
198
-
199
-
200
-
201
-
202
-
203
-
204
-
205
-
206
-
207
-
208
-
209
-
210
-
211
-
212
-
213
-
214
-
215
-
216
-
217
-
218
-
219
-
220
-
221
-
222
-
223
-
224
-
225
-
226
-
227
-
228
-
229
-
230
-
231
-
232
-
233
-
234
-
235
-
236
-
237
-
238
-
239
-
240
-
241
-
242
-
243
 |
 |

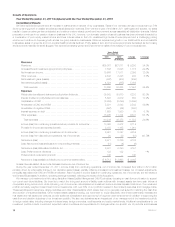
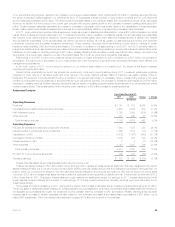
of our securities lending program, resulted in an increase in our average invested assets, which contributed $189 million to operating earnings. Mirroring
the growth in average invested assets in our individual life and LTC businesses, interest credited on long-duration contracts and on our policyholder
account balances increased by $76 million. The aforementioned increased sales of our individual variable and universal life products, which was mainly
driven by our launch of a new product in the current year, coupled with ongoing organic growth in the business, increased operating earnings by $41
million. These increased sales also generated an increase in commission expenses, which was mostly offset by the capitalization of these expenses.
Broker–dealer related revenues also increased during the year and were significantly offset by a corresponding increase in other expenses.
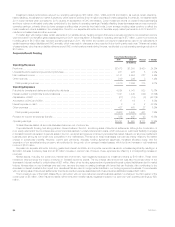
In 2011, pricing actions and improved claims experience, mainly as a result of stabilizing benefits utilization, drove a $57 million increase in our dental
results. Higher closures and lower incidences in 2011 contributed to the $43 million increase in our disability results. Our life businesses were essentially
flat; however, lower claims incidence resulted in very strong group life mortality gains, which were offset by increased severity of claims in the variable
and universal life businesses. On an annual basis, we perform experience studies, as well as update our assumptions surrounding both expected
policyholder behaviors and the related investment environment. These updates, commonly known as unlocking events, result in changes to certain
insurance related liabilities, DAC and revenue amortization. The impact of updates to our assumptions, in both 2011 and 2010 primarily related to
policyholder behaviors, such as projected premium assumptions and various factors impacting persistency, coupled with insurance related refinements,
resulted in a net increase to operating earnings of $41 million. Partially offsetting these favorable impacts was a $109 million charge, recorded in the
third quarter of the current year, related to our use of the Death Master File, in both our group and individual life businesses.
Refinements in our DAC model in both years as well as the impact of higher amortization in 2010 contributed to a $37 million net decrease in
amortization. The higher level of amortization in 2010 was primarily due to the emergence of actual premium and lapse information which differed from
management’s expectations.
In the fourth quarter of 2011, we announced a reduction to our dividend scale related to our closed block. The impact of this action increased
operating earnings by $54 million.
Market factors, specifically the current low interest rate environment, continued to be a challenge during 2011. Investment yields were negatively
impacted by lower returns on allocated equity and lower returns in the equity markets, partially offset by improving real estate markets. Unlike in
Retirement Products and Corporate Benefit Funding, a reduction in investment yield does not necessarily drive a corresponding change in the rates
credited on policyholder account balances or amounts held for future policyholder benefits. The reduction in investment yield resulted in a $164 million
decrease in operating earnings. Partially offsetting this decline was the impact of updating projected market factors as part of our aforementioned annual
update to assumptions. This update resulted in an unlocking event, resulting in a $32 million increase to operating earnings.
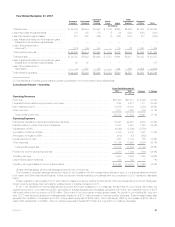
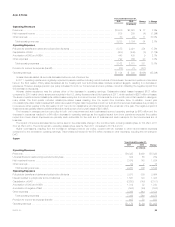
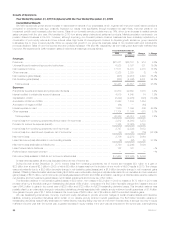
Retirement Products
Years Ended December 31,
Change % Change2011 2010
(In millions)
Operating Revenues
Premiums .......................................................................... $1,141 $ 875 $ 266 30.4%
Universal life and investment-type product policy fees ........................................ 2,463 2,024 439 21.7%
Net investment income ............................................................... 3,195 3,395 (200) (5.9)%
Other revenues ..................................................................... 307 220 87 39.5%
Total operating revenues ............................................................ 7,106 6,514 592 9.1%
Operating Expenses
Policyholder benefits and claims and policyholder dividends ................................... 1,846 1,487 359 24.1%
Interest credited to policyholder account balances .......................................... 1,595 1,612 (17) (1.1)%
Capitalization of DAC ................................................................. (1,612) (1,067) (545) (51.1)%
Amortization of DAC and VOBA ......................................................... 1,004 808 196 24.3%
Interest expense on debt .............................................................. 2 3 (1) (33.3)%
Other expenses ..................................................................... 3,143 2,437 706 29.0%
Total operating expenses ............................................................ 5,978 5,280 698 13.2%
Provision for income tax expense (benefit) ................................................. 395 431 (36) (8.4)%
Operating earnings ................................................................... $ 733 $ 803 $ (70) (8.7)%
Unless otherwise stated, all amounts discussed below are net of income tax.
Total annuity sales increased 51% to $30.4 billion due to strong growth in variable annuities across all distribution channels. Variable annuity product
sales increased primarily due to the introduction of a new higher benefit, lower-risk variable annuity rider and changes in competitors’ offerings which, we
believe, made our products more attractive. We have launched several changes to the products and riders we offer that we expect will reduce sales
volumes in 2012, as we manage these sales volumes to strike the right balance among growth, profitability and risk. Total annuity net flows were $16.2
billion, higher than in 2010. Changes in interest rates and equity markets can significantly impact our earnings. In 2011, interest rates declined while
equity markets remained relatively flat compared to much stronger 2010 equity market performance. Operating earnings were down 9% mainly due to
these market factors.
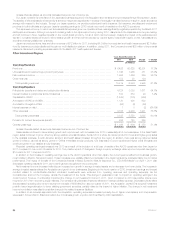
Strong sales and higher persistency in 2011, along with the impact of an increase in allocated equity, increased operating earnings by $147 million.
The strong sales of variable annuities increased our average separate account assets and, as a result, we generated higher asset-based fee revenue on
the separate account assets and higher net investment income, partially offset by increases in DAC amortization. Partially offsetting these favorable
impacts was an increase in variable expenses, primarily related to new business commissions and asset-based commissions of $38 million, net of
related DAC capitalization. Other non-variable expenses also increased $16 million due to growth in the business.
MetLife, Inc. 23