MetLife 2011 Annual Report Download - page 54
Download and view the complete annual report
Please find page 54 of the 2011 MetLife annual report below. You can navigate through the pages in the report by either clicking on the pages listed below, or by using the keyword search tool below to find specific information within the annual report.-
 1
1 -
2
-
3
-
4
-
5
-
6
-
7
-
8
-
9
-
10
-
11
-
12
-
13
-
14
-
15
-
16
-
17
-
18
-
19
-
20
-
21
-
22
-
23
-
24
-
25
-
26
-
27
-
28
-
29
-
30
-
31
-
32
-
33
-
34
-
35
-
36
-
37
-
38
-
39
-
40
-
41
-
42
-
43
-
 44
44 -
 45
45 -
 46
46 -
 47
47 -
 48
48 -
 49
49 -
 50
50 -
 51
51 -
 52
52 -
 53
53 -
 54
54 -
 55
55 -
 56
56 -
 57
57 -
 58
58 -
 59
59 -
 60
60 -
 61
61 -
 62
62 -
 63
63 -
 64
64 -
65
-
66
-
67
-
68
-
69
-
70
-
71
-
72
-
73
-
74
-
75
-
76
-
77
-
78
-
79
-
80
-
81
-
82
-
83
-
84
-
85
-
86
-
87
-
88
-
89
-
90
-
91
-
92
-
93
-
94
-
95
-
96
-
97
-
98
-
99
-
100
-
101
-
102
-
103
-
104
-
105
-
106
-
107
-
108
-
109
-
110
-
111
-
112
-
113
-
114
-
115
-
116
-
117
-
118
-
119
-
120
-
121
-
122
-
123
-
124
-
125
-
126
-
127
-
128
-
129
-
130
-
131
-
132
-
133
-
134
-
135
-
136
-
137
-
138
-
139
-
140
-
141
-
142
-
143
-
144
-
145
-
146
-
147
-
148
-
149
-
150
-
151
-
152
-
153
-
154
-
155
-
156
-
157
-
158
-
159
-
160
-
161
-
162
-
163
-
164
-
165
-
166
-
167
-
168
-
169
-
170
-
171
-
172
-
173
-
174
-
175
-
176
-
177
-
178
-
179
-
180
-
181
-
182
-
183
-
184
-
185
-
186
-
187
-
188
-
189
-
190
-
191
-
192
-
193
-
194
-
195
-
196
-
197
-
198
-
199
-
200
-
201
-
202
-
203
-
204
-
205
-
206
-
207
-
208
-
209
-
210
-
211
-
212
-
213
-
214
-
215
-
216
-
217
-
218
-
219
-
220
-
221
-
222
-
223
-
224
-
225
-
226
-
227
-
228
-
229
-
230
-
231
-
232
-
233
-
234
-
235
-
236
-
237
-
238
-
239
-
240
-
241
-
242
-
243
 |
 |

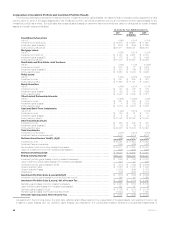
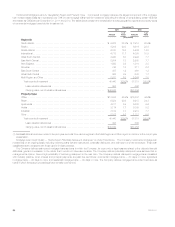
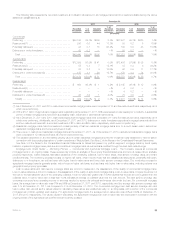
RMBS. The table below presents information on RMBS holdings at:
December 31,
2011 2010
Estimated
Fair
Value %of
Total
Estimated
Fair
Value %of
Total
(In millions) (In millions)
By security type:
Collateralized mortgage obligations .................................... $23,392 54.9% $23,422 51.1%
Pass-through securities ............................................. 19,245 45.1 22,430 48.9
Total RMBS ..................................................... $42,637 100.0 % $45,852 100.0%
By risk profile:
Agency .......................................................... $31,055 72.8% $34,254 74.7%
Prime ........................................................... 5,959 14.0 6,258 13.7
Alt-A ............................................................ 4,648 10.9 4,221 9.2
Sub-prime ........................................................ 975 2.3 1,119 2.4
Total RMBS ..................................................... $42,637 100.0% $45,852 100.0%
Collateralized mortgage obligations are a type of mortgage-backed security structured by dividing the cash flows of mortgages into separate pools or
tranches of risk that create multiple classes of bonds with varying maturities and priority of payments. Pass-through mortgage-backed securities are a
type of asset-backed security that is secured by a mortgage or collection of mortgages. The monthly mortgage payments from homeowners pass from
the originating bank through an intermediary, such as a government agency or investment bank, which collects the payments and, for a fee, remits or
passes these payments through to the holders of the pass-through securities.
The majority of RMBS held by the Company was rated Aaa/AAA by Moody’s, S&P or Fitch; and the majority was rated NAIC 1 by the NAIC at
December 31, 2011 and 2010, as presented above. Agency RMBS were guaranteed or otherwise supported by FNMA, FHLMC or GNMA.
Non-agency RMBS include prime, Alt-A and sub-prime RMBS. Prime residential mortgage lending includes the origination of residential mortgage loans
to the most creditworthy borrowers with high quality credit profiles. Alt-A is a classification of mortgage loans where the risk profile of the borrower falls
between prime and sub-prime. Sub-prime mortgage lending is the origination of residential mortgage loans to borrowers with weak credit profiles.
Included within prime and Alt-A RMBS are resecuritization of real estate mortgage investment conduit (“Re-REMIC”) securities. Re-REMIC RMBS involve
the pooling of previous issues of prime and Alt-A RMBS and restructuring the combined pools to create new senior and subordinated securities. The
credit enhancement on the senior tranches is improved through the resecuritization.
At December 31, 2011 and 2010, the Company’s Alt-A securities portfolio has no exposure to option adjustable rate mortgages (“ARMs”) and a
minimal exposure to hybrid ARMs. The Company’s Alt-A securities portfolio is comprised primarily of fixed rate mortgages (93% and 91% at
December 31, 2011 and 2010, respectively) which have performed better than both option ARMs and hybrid ARMs in the overall Alt-A market. The
Company’s Alt-A RMBS holdings had unrealized losses of $871 million and $670 million at December 31, 2011 and 2010, respectively. Approximately
7% and 16% of this portfolio was rated Aa or better at December 31, 2011 and 2010, respectively.
The sub-prime RMBS had unrealized losses of $347 million and $317 million at December 31, 2011 and 2010, respectively. At December 31,
2011, approximately 21% of this portfolio was rated Aa or better, of which 79% was in vintage year 2005 and prior. At December 31, 2010,
approximately 54% of this portfolio was rated Aa or better, of which 88% was in vintage year 2005 and prior. These older vintages from 2005 and prior
benefit from better underwriting, improved credit enhancement levels and higher residential property price appreciation. Approximately 69% and 66% of
this portfolio was rated NAIC 2 or better at December 31, 2011 and 2010, respectively. The slowing U.S. housing market, greater use of affordable
mortgage products and relaxed underwriting standards for some originators of sub-prime residential mortgage loans have led to higher delinquency and
loss rates, especially within the 2006 and 2007 vintage years. These factors have caused a pull-back in market liquidity and repricing of risk, which has
led to higher levels of unrealized losses on securities backed by sub-prime residential mortgage loans as compared to historical levels.
50 MetLife, Inc.