MetLife 2011 Annual Report Download - page 35
Download and view the complete annual report
Please find page 35 of the 2011 MetLife annual report below. You can navigate through the pages in the report by either clicking on the pages listed below, or by using the keyword search tool below to find specific information within the annual report.-
 1
1 -
2
-
3
-
4
-
5
-
6
-
7
-
8
-
9
-
10
-
11
-
12
-
13
-
14
-
15
-
16
-
17
-
18
-
19
-
20
-
21
-
22
-
23
-
24
-
 25
25 -
 26
26 -
 27
27 -
 28
28 -
 29
29 -
 30
30 -
 31
31 -
 32
32 -
 33
33 -
 34
34 -
 35
35 -
 36
36 -
 37
37 -
 38
38 -
 39
39 -
 40
40 -
 41
41 -
 42
42 -
 43
43 -
 44
44 -
 45
45 -
46
-
47
-
48
-
49
-
50
-
51
-
52
-
53
-
54
-
55
-
56
-
57
-
58
-
59
-
60
-
61
-
62
-
63
-
64
-
65
-
66
-
67
-
68
-
69
-
70
-
71
-
72
-
73
-
74
-
75
-
76
-
77
-
78
-
79
-
80
-
81
-
82
-
83
-
84
-
85
-
86
-
87
-
88
-
89
-
90
-
91
-
92
-
93
-
94
-
95
-
96
-
97
-
98
-
99
-
100
-
101
-
102
-
103
-
104
-
105
-
106
-
107
-
108
-
109
-
110
-
111
-
112
-
113
-
114
-
115
-
116
-
117
-
118
-
119
-
120
-
121
-
122
-
123
-
124
-
125
-
126
-
127
-
128
-
129
-
130
-
131
-
132
-
133
-
134
-
135
-
136
-
137
-
138
-
139
-
140
-
141
-
142
-
143
-
144
-
145
-
146
-
147
-
148
-
149
-
150
-
151
-
152
-
153
-
154
-
155
-
156
-
157
-
158
-
159
-
160
-
161
-
162
-
163
-
164
-
165
-
166
-
167
-
168
-
169
-
170
-
171
-
172
-
173
-
174
-
175
-
176
-
177
-
178
-
179
-
180
-
181
-
182
-
183
-
184
-
185
-
186
-
187
-
188
-
189
-
190
-
191
-
192
-
193
-
194
-
195
-
196
-
197
-
198
-
199
-
200
-
201
-
202
-
203
-
204
-
205
-
206
-
207
-
208
-
209
-
210
-
211
-
212
-
213
-
214
-
215
-
216
-
217
-
218
-
219
-
220
-
221
-
222
-
223
-
224
-
225
-
226
-
227
-
228
-
229
-
230
-
231
-
232
-
233
-
234
-
235
-
236
-
237
-
238
-
239
-
240
-
241
-
242
-
243
 |
 |

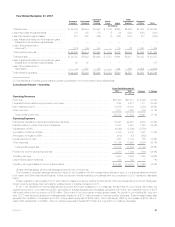
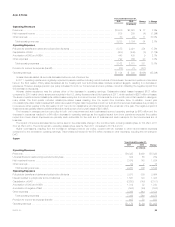
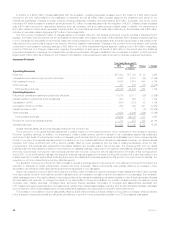
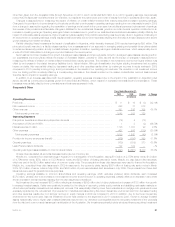
Consolidated Results – Operating
Years Ended December 31,
2010 2009 Change % Change
(In millions)
Operating Revenues
Premiums ......................................................................... $27,071 $26,157 $ 914 3.5%
Universal life and investment-type product policy fees ....................................... 5,817 5,055 762 15.1%
Net investment income ............................................................... 16,880 14,600 2,280 15.6%
Other revenues ..................................................................... 1,675 1,473 202 13.7%
Total operating revenues ............................................................ 51,443 47,285 4,158 8.8%
Operating Expenses
Policyholder benefits and claims and policyholder dividends .................................. 29,972 29,104 868 3.0%
Interest credited to policyholder account balances .......................................... 4,697 4,849 (152) (3.1)%
Capitalization of DAC ................................................................ (3,299) (2,976) (323) (10.9)%
Amortization of DAC and VOBA ........................................................ 2,802 2,186 616 28.2%
Amortization of negative VOBA ......................................................... (57) — (57)
Interest expense on debt ............................................................. 1,139 1,044 95 9.1%
Other expenses .................................................................... 10,690 10,152 538 5.3%
Total operating expenses ........................................................... 45,944 44,359 1,585 3.6%
Provision for income tax expense (benefit) ................................................ 1,544 572 972
Operating earnings .................................................................. 3,955 2,354 1,601 68.0%
Less: Preferred stock dividends ........................................................ 122 122 — —%
Operating earnings available to common shareholders ...................................... $ 3,833 $ 2,232 $1,601 71.7%
Unless otherwise stated, all amounts discussed below are net of income tax.
The improvement in the financial markets was the primary driver of the increase in operating earnings as evidenced by higher net investment income
and an increase in average separate account balances, which resulted in an increase in policy fee income. Partially offsetting this improvement was an
increase in amortization of DAC, VOBA and DSI. The increase in operating earnings also includes the positive impact of changes in foreign currency
exchange rates in 2010. This improved reported operating earnings by $37 million for 2010 compared to 2009. Furthermore, the 2010 period also
includes one month of ALICO results, contributing $114 million to the increase in operating earnings. The current period also benefited from the dividend
scale reduction in the fourth quarter of 2009. The improvement in 2010 results compared to 2009 was partially offset by the prior period impact of
pesification in Argentina and unfavorable claims experience.
Net investment income increased from higher yields and growth in average invested assets. Yields were positively impacted by the effects of
stabilizing real estate markets and recovering private equity markets year over year on real estate joint ventures and other limited partnership interests,
and by the effects of continued repositioning of the accumulated liquidity in our portfolio to longer duration and higher yielding investments, including
investment grade corporate fixed maturity securities. Growth in our investment portfolio was primarily due to the Acquisition and positive net cash flows
from growth in our domestic individual and group life businesses, as well as certain international businesses, higher cash collateral balances received
from our derivative counterparties, as well as the temporary investment of proceeds from the debt and common stock issuances in anticipation of the
Acquisition. With the exception of the cash flows from such securities issuances, which were temporarily invested in lower yielding liquid investments,
we continued to reposition the accumulated liquidity in our portfolio to longer duration and higher yielding investments.
Since many of our products are interest spread-based, higher net investment income is typically offset by higher interest credited expense.
However, interest credited expense, including amounts reflected in policyholder benefits and claims, decreased primarily in our domestic funding
agreement business, which experienced lower average crediting rates combined with lower average account balances. Our fixed annuities business
also experienced lower crediting rates. Certain crediting rates can move consistently with the underlying market indices, primarily the London Inter-Bank
Offer Rate (“LIBOR”), which were lower than the prior year. The impact from the growth in our structured settlement, LTC and disability businesses
partially offset those decreases in interest credited expense.
A significant increase in average separate account balances is largely attributable to favorable market performance resulting from improved market
conditions since the second quarter of 2009 and positive net cash flows from the annuity business. This resulted in higher policy fees and other
revenues of $444 million, most notably in our Retirement Products segment. In addition, changes in foreign currency exchange rates increased policy
fees by $52 million. The improvement in fees is partially offset by greater DAC, VOBA and DSI amortization of $325 million. Policy fees are typically
calculated as a percentage of the average assets in the separate accounts. DAC, VOBA and DSI amortization is based on the earnings of the business,
which in the retirement business are derived, in part, from fees earned on separate account balances. A portion of the increase in amortization was due
to the impact of higher current year gross margins, a primary component in the determination of the amount of amortization for our Insurance Products
segment, mostly in the closed block resulting from increased investment yields and the impact of dividend scale reductions.
The reduction in the dividend scale in the fourth quarter of 2009 resulted in a $109 million decrease in policyholder dividends in the traditional life
business in the current period.
Claims experience varied amongst our businesses with a net unfavorable impact of $153 million to operating earnings compared to the prior year.
We had unfavorable claims experience in our Auto & Home segment, primarily due to increased catastrophes. Our Insurance Products segment
experienced mixed claims experience with a net unfavorable impact. We experienced less favorable mortality experience in our Corporate Benefit
Funding segment despite favorable experience in our structured settlements business.
Interest expense increased $62 million primarily as a result of the full year impact of debt issuances in 2009 and of senior notes and debt securities
issued in anticipation of the Acquisition, partially offset by the impact of lower interest rates on variable rate collateral financing arrangements.
MetLife, Inc. 31