MetLife 2011 Annual Report Download - page 39
Download and view the complete annual report
Please find page 39 of the 2011 MetLife annual report below. You can navigate through the pages in the report by either clicking on the pages listed below, or by using the keyword search tool below to find specific information within the annual report.-
 1
1 -
2
-
3
-
4
-
5
-
6
-
7
-
8
-
9
-
10
-
11
-
12
-
13
-
14
-
15
-
16
-
17
-
18
-
19
-
20
-
21
-
22
-
23
-
24
-
25
-
26
-
27
-
28
-
 29
29 -
 30
30 -
 31
31 -
 32
32 -
 33
33 -
 34
34 -
 35
35 -
 36
36 -
 37
37 -
 38
38 -
 39
39 -
 40
40 -
 41
41 -
 42
42 -
 43
43 -
 44
44 -
 45
45 -
 46
46 -
 47
47 -
 48
48 -
 49
49 -
50
-
51
-
52
-
53
-
54
-
55
-
56
-
57
-
58
-
59
-
60
-
61
-
62
-
63
-
64
-
65
-
66
-
67
-
68
-
69
-
70
-
71
-
72
-
73
-
74
-
75
-
76
-
77
-
78
-
79
-
80
-
81
-
82
-
83
-
84
-
85
-
86
-
87
-
88
-
89
-
90
-
91
-
92
-
93
-
94
-
95
-
96
-
97
-
98
-
99
-
100
-
101
-
102
-
103
-
104
-
105
-
106
-
107
-
108
-
109
-
110
-
111
-
112
-
113
-
114
-
115
-
116
-
117
-
118
-
119
-
120
-
121
-
122
-
123
-
124
-
125
-
126
-
127
-
128
-
129
-
130
-
131
-
132
-
133
-
134
-
135
-
136
-
137
-
138
-
139
-
140
-
141
-
142
-
143
-
144
-
145
-
146
-
147
-
148
-
149
-
150
-
151
-
152
-
153
-
154
-
155
-
156
-
157
-
158
-
159
-
160
-
161
-
162
-
163
-
164
-
165
-
166
-
167
-
168
-
169
-
170
-
171
-
172
-
173
-
174
-
175
-
176
-
177
-
178
-
179
-
180
-
181
-
182
-
183
-
184
-
185
-
186
-
187
-
188
-
189
-
190
-
191
-
192
-
193
-
194
-
195
-
196
-
197
-
198
-
199
-
200
-
201
-
202
-
203
-
204
-
205
-
206
-
207
-
208
-
209
-
210
-
211
-
212
-
213
-
214
-
215
-
216
-
217
-
218
-
219
-
220
-
221
-
222
-
223
-
224
-
225
-
226
-
227
-
228
-
229
-
230
-
231
-
232
-
233
-
234
-
235
-
236
-
237
-
238
-
239
-
240
-
241
-
242
-
243
 |
 |

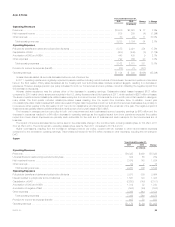
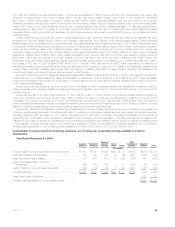
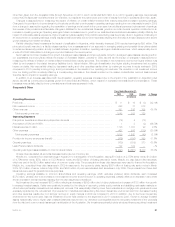
Auto & Home
Years Ended December 31,
Change % Change2010 2009
(In millions)
Operating Revenues
Premiums .......................................................................... $2,923 $2,902 $ 21 0.7%
Net investment income ............................................................... 209 180 29 16.1%
Other revenues ..................................................................... 22 33 (11) (33.3)%
Total operating revenues ............................................................ 3,154 3,115 39 1.3%
Operating Expenses
Policyholder benefits and claims and policyholder dividends ................................... 2,021 1,932 89 4.6%
Capitalization of DAC ................................................................. (448) (435) (13) (3.0)%
Amortization of DAC and VOBA ......................................................... 439 436 3 0.7%
Other expenses ..................................................................... 769 764 5 0.7%
Total operating expenses ............................................................ 2,781 2,697 84 3.1%
Provision for income tax expense (benefit) ................................................. 73 96 (23) (24.0)%
Operating earnings ................................................................... $ 300 $ 322 $(22) (6.8)%
Unless otherwise stated, all amounts discussed below are net of income tax.
The improving housing and automobile markets have provided opportunities that led to increased new business sales for both homeowners and
auto policies in 2010. Sales of new policies increased 11% for our homeowners business and 4% for our auto business in 2010 compared to 2009.
Average premium per policy also improved in 2010 over 2009 in our homeowners businesses but remained flat in our auto business.
The primary driver of the $22 million decrease in operating earnings was unfavorable claims experience, partially offset by higher net investment
income and increased premiums.
Catastrophe-related losses increased by $58 million compared to 2009 due to increases in both the number and severity of storms. The 2010 claim
costs decreased $19 million as a result of lower frequencies in both our auto and homeowners businesses; however, this was partially offset by a
$13 million increase in claims due to higher severity in our homeowners business. Also contributing to the decline in operating earnings was an increase
of $7 million in loss adjusting expenses, primarily related to a decrease in our unallocated loss adjusting expense liabilities at the end of 2009.
The impact of the items discussed above can be seen in the unfavorable change in the combined ratio, including catastrophes, increasing to 94.6%
in 2010 from 92.3% in 2009 and the favorable change in the combined ratio, excluding catastrophes, decreasing to 88.1% in 2010 from 88.9% in
2009.
A $19 million increase in net investment income partially offset the declines in operating earnings discussed above. Net investment income was
higher primarily as a result of an increase in average invested assets, including changes in allocated equity, partially offset by a decrease in yields. This
portfolio is comprised primarily of high quality municipal bonds.
The increase in average premium per policy in our homeowners businesses improved operating earnings by $10 million as did an increase in
exposures which improved operating earnings by $1 million. Exposures are primarily each automobile for the auto line of business and each residence
for the property line of business. Also improving operating earnings, through an increase in premiums, was a $5 million reduction in reinsurance costs.
The slight increase in other expenses was more than offset by an $8 million increase in DAC capitalization, resulting primarily from increased
premiums written.
In addition, a first quarter 2010 write-off of an equity interest in a mandatory state underwriting pool required by a change in legislation and a
decrease in income from a retroactive reinsurance agreement in run-off, both of which were recorded in other revenues, drove a $7 million decrease in
operating earnings. Auto & Home also benefited from a lower effective tax rate which improved operating earnings by $8 million primarily as a result of
tax free interest income representing a larger portion of pre-tax income.
MetLife, Inc. 35