MetLife 2011 Annual Report Download - page 18
Download and view the complete annual report
Please find page 18 of the 2011 MetLife annual report below. You can navigate through the pages in the report by either clicking on the pages listed below, or by using the keyword search tool below to find specific information within the annual report.-
 1
1 -
2
-
3
-
4
-
5
-
6
-
7
-
 8
8 -
 9
9 -
 10
10 -
 11
11 -
 12
12 -
 13
13 -
 14
14 -
 15
15 -
 16
16 -
 17
17 -
 18
18 -
 19
19 -
 20
20 -
 21
21 -
 22
22 -
 23
23 -
 24
24 -
 25
25 -
 26
26 -
 27
27 -
 28
28 -
29
-
30
-
31
-
32
-
33
-
34
-
35
-
36
-
37
-
38
-
39
-
40
-
41
-
42
-
43
-
44
-
45
-
46
-
47
-
48
-
49
-
50
-
51
-
52
-
53
-
54
-
55
-
56
-
57
-
58
-
59
-
60
-
61
-
62
-
63
-
64
-
65
-
66
-
67
-
68
-
69
-
70
-
71
-
72
-
73
-
74
-
75
-
76
-
77
-
78
-
79
-
80
-
81
-
82
-
83
-
84
-
85
-
86
-
87
-
88
-
89
-
90
-
91
-
92
-
93
-
94
-
95
-
96
-
97
-
98
-
99
-
100
-
101
-
102
-
103
-
104
-
105
-
106
-
107
-
108
-
109
-
110
-
111
-
112
-
113
-
114
-
115
-
116
-
117
-
118
-
119
-
120
-
121
-
122
-
123
-
124
-
125
-
126
-
127
-
128
-
129
-
130
-
131
-
132
-
133
-
134
-
135
-
136
-
137
-
138
-
139
-
140
-
141
-
142
-
143
-
144
-
145
-
146
-
147
-
148
-
149
-
150
-
151
-
152
-
153
-
154
-
155
-
156
-
157
-
158
-
159
-
160
-
161
-
162
-
163
-
164
-
165
-
166
-
167
-
168
-
169
-
170
-
171
-
172
-
173
-
174
-
175
-
176
-
177
-
178
-
179
-
180
-
181
-
182
-
183
-
184
-
185
-
186
-
187
-
188
-
189
-
190
-
191
-
192
-
193
-
194
-
195
-
196
-
197
-
198
-
199
-
200
-
201
-
202
-
203
-
204
-
205
-
206
-
207
-
208
-
209
-
210
-
211
-
212
-
213
-
214
-
215
-
216
-
217
-
218
-
219
-
220
-
221
-
222
-
223
-
224
-
225
-
226
-
227
-
228
-
229
-
230
-
231
-
232
-
233
-
234
-
235
-
236
-
237
-
238
-
239
-
240
-
241
-
242
-
243
 |
 |

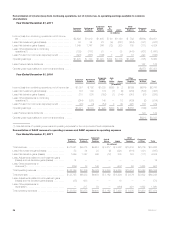
policy issuance expenses and certain advertising costs. VOBA represents the excess of book value over the estimated fair value of acquired insurance,
annuity, and investment-type contracts in-force at the acquisition date. For certain acquired blocks of business, the estimated fair value of the in-force
contract obligations exceeded the book value of assumed in-force insurance policy liabilities, resulting in negative VOBA, which is presented separately
from VOBA as an additional insurance liability included in other policy-related balances. The estimated fair value of the acquired liabilities is based on
actuarially determined projections, by each block of business, of future policy and contract charges, premiums, mortality and morbidity, separate
account performance, surrenders, operating expenses, investment returns, nonperformance risk adjustment and other factors. Actual experience on the
purchased business may vary from these projections. The recovery of DAC and VOBA is dependent upon the future profitability of the related business.
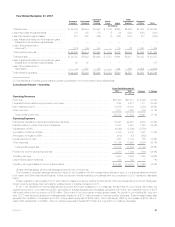
The Company will adopt new guidance regarding the accounting for DAC beginning in the first quarter of 2012 and will apply it retrospectively to all prior
periods presented in its consolidated financial statements for all insurance contracts. See Note 1 of the Notes to the Consolidated Financial Statements.
Separate account rates of return on variable universal life contracts and variable deferred annuity contracts affect in-force account balances on such
contracts each reporting period which can result in significant fluctuations in amortization of DAC and VOBA. The Company’s practice to determine the
impact of gross profits resulting from returns on separate accounts assumes that long-term appreciation in equity markets is not changed by short-term
market fluctuations, but is only changed when sustained interim deviations are expected. The Company monitors these events and only changes the
assumption when its long-term expectation changes. The effect of an increase/(decrease) by 100 basis points in the assumed future rate of return is
reasonably likely to result in a decrease/(increase) in the DAC and VOBA amortization of approximately $161 million with an offset to the Company’s
unearned revenue liability of approximately $26 million for this factor.
The Company also periodically reviews other long-term assumptions underlying the projections of estimated gross margins and profits. These
include investment returns, policyholder dividend scales, interest crediting rates, mortality, persistency, and expenses to administer business.
Assumptions used in the calculation of estimated gross margins and profits which may have significantly changed are updated annually. If the update of
assumptions causes expected future gross margins and profits to increase, DAC and VOBA amortization will decrease, resulting in a current period
increase to earnings. The opposite result occurs when the assumption update causes expected future gross margins and profits to decrease.
The Company’s most significant assumption updates resulting in a change to expected future gross margins and profits and the amortization of DAC
and VOBA are due to revisions to expected future investment returns, expenses, in-force or persistency assumptions and policyholder dividends on
participating traditional life contracts, variable and universal life contracts and annuity contracts. The Company expects these assumptions to be the
ones most reasonably likely to cause significant changes in the future. Changes in these assumptions can be offsetting and the Company is unable to
predict their movement or offsetting impact over time.
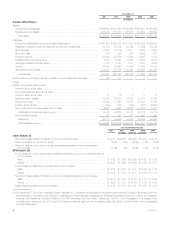
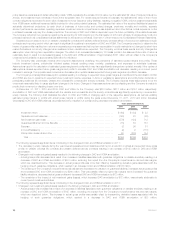
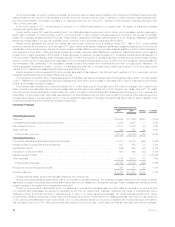
At December 31, 2011, 2010 and 2009, DAC and VOBA for the Company was $28.0 billion, $27.1 billion and $19.1 billion, respectively.
Amortization of DAC and VOBA associated with the variable and universal life and the annuity contracts was significantly impacted by movements in
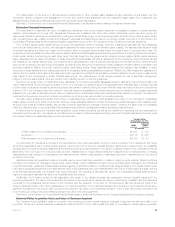
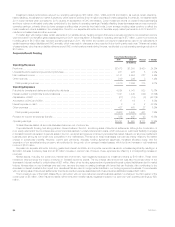
equity markets. The following chart illustrates the effect on DAC and VOBA of changing each of the respective assumptions, as well as updating
estimated gross margins or profits with actual gross margins or profits during the years ended December 31, 2011, 2010 and 2009. Increases
(decreases) in DAC and VOBA balances, as presented below, resulted in a corresponding decrease (increase) in amortization.
Years Ended December 31,
2011 2010 2009
(In millions)
Investment return .............................................................. $ (64) $ (84) $ 22
Separate account balances ...................................................... (145) 23 (85)
Net investment gain (loss) ....................................................... (576) (124) 712
Guaranteed Minimum Income Benefits ............................................. (15) 84 187
Expense ..................................................................... (7) 96 61
In-force/Persistency ............................................................ (2) 9 (118)
Policyholder dividends and other .................................................. 60 (203) 154
Total ...................................................................... $(749) $(199) $ 933
The following represents significant items contributing to the changes to DAC and VOBA amortization in 2011:
‰The decrease in equity markets during the year lowered separate account balances which led to a reduction in actual and expected future gross
profits on variable universal life contracts and variable deferred annuity contracts resulting in an increase of $145 million in DAC and VOBA
amortization.
‰Changes in net investment gains (losses) resulted in the following changes in DAC and VOBA amortization:
– Actual gross profits decreased as a result of an increase in liabilities associated with guarantee obligations on variable annuities, resulting in a
decrease of DAC and VOBA amortization of $531 million, excluding the impact from the Company’s nonperformance risk and risk margins,
which are described below. This decrease in actual gross profits was more than offset by freestanding derivative gains associated with the
hedging of such guarantee obligations, which resulted in an increase in DAC and VOBA amortization of $847 million.
– The widening of the Company’s nonperformance risk adjustment decreased the valuation of guarantee liabilities, increased actual gross profits
and increased DAC and VOBA amortization by $260 million. This was partially offset by higher risk margins which increased the guarantee
liability valuations, decreased actual gross profits and decreased DAC and VOBA amortization by $72 million.
– The remainder of the impact of net investment gains (losses), which increased DAC amortization by $72 million, was primarily attributable to
current period investment activities.
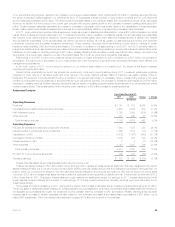
The following represents significant items contributing to the changes to DAC and VOBA amortization in 2010:
‰Changes in net investment gains (losses) resulted in the following changes in DAC and VOBA amortization:
– Actual gross profits increased as a result of a decrease in liabilities associated with guarantee obligations on variable annuities, resulting in an
increase of DAC and VOBA amortization of $197 million, excluding the impact from the Company’s nonperformance risk and risk margins,
which are described below. This increase in actual gross profits was partially offset by freestanding derivative losses associated with the
hedging of such guarantee obligations, which resulted in a decrease in DAC and VOBA amortization of $88 million.
14 MetLife, Inc.