MetLife 2011 Annual Report Download - page 62
Download and view the complete annual report
Please find page 62 of the 2011 MetLife annual report below. You can navigate through the pages in the report by either clicking on the pages listed below, or by using the keyword search tool below to find specific information within the annual report.-
 1
1 -
2
-
3
-
4
-
5
-
6
-
7
-
8
-
9
-
10
-
11
-
12
-
13
-
14
-
15
-
16
-
17
-
18
-
19
-
20
-
21
-
22
-
23
-
24
-
25
-
26
-
27
-
28
-
29
-
30
-
31
-
32
-
33
-
34
-
35
-
36
-
37
-
38
-
39
-
40
-
41
-
42
-
43
-
44
-
45
-
46
-
47
-
48
-
49
-
50
-
51
-
 52
52 -
 53
53 -
 54
54 -
 55
55 -
 56
56 -
 57
57 -
 58
58 -
 59
59 -
 60
60 -
 61
61 -
 62
62 -
 63
63 -
 64
64 -
 65
65 -
 66
66 -
 67
67 -
 68
68 -
 69
69 -
 70
70 -
 71
71 -
 72
72 -
73
-
74
-
75
-
76
-
77
-
78
-
79
-
80
-
81
-
82
-
83
-
84
-
85
-
86
-
87
-
88
-
89
-
90
-
91
-
92
-
93
-
94
-
95
-
96
-
97
-
98
-
99
-
100
-
101
-
102
-
103
-
104
-
105
-
106
-
107
-
108
-
109
-
110
-
111
-
112
-
113
-
114
-
115
-
116
-
117
-
118
-
119
-
120
-
121
-
122
-
123
-
124
-
125
-
126
-
127
-
128
-
129
-
130
-
131
-
132
-
133
-
134
-
135
-
136
-
137
-
138
-
139
-
140
-
141
-
142
-
143
-
144
-
145
-
146
-
147
-
148
-
149
-
150
-
151
-
152
-
153
-
154
-
155
-
156
-
157
-
158
-
159
-
160
-
161
-
162
-
163
-
164
-
165
-
166
-
167
-
168
-
169
-
170
-
171
-
172
-
173
-
174
-
175
-
176
-
177
-
178
-
179
-
180
-
181
-
182
-
183
-
184
-
185
-
186
-
187
-
188
-
189
-
190
-
191
-
192
-
193
-
194
-
195
-
196
-
197
-
198
-
199
-
200
-
201
-
202
-
203
-
204
-
205
-
206
-
207
-
208
-
209
-
210
-
211
-
212
-
213
-
214
-
215
-
216
-
217
-
218
-
219
-
220
-
221
-
222
-
223
-
224
-
225
-
226
-
227
-
228
-
229
-
230
-
231
-
232
-
233
-
234
-
235
-
236
-
237
-
238
-
239
-
240
-
241
-
242
-
243
 |
 |

equity options with unobservable volatility inputs or that are priced via independent broker quotations; and credit forwards having unobservable
repurchase rates.
At December 31, 2011 and 2010, 5% and 2%, respectively, of the net derivative estimated fair value was priced via independent broker quotations.
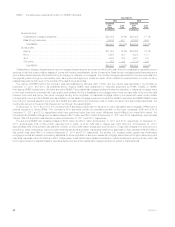
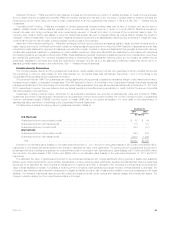
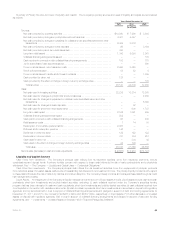
A rollforward of the fair value measurements for net derivatives measured at estimated fair value on a recurring basis using significant unobservable
(Level 3) inputs for the year ended December 31, 2011 is as follows:
Year Ended
December 31, 2011
(In millions)
Balance, beginning of period .................................................................. $ 173
Total realized/unrealized gains (losses) included in: ...............................................
Earnings .............................................................................. 637
Other comprehensive income (loss) ......................................................... 344
Purchases, sales, issuances and settlements ................................................... 156
Transfer into and/or out of Level 3 ............................................................. (76)
Balance, end of period ....................................................................... $1,234
See “— Summary of Critical Accounting Estimates — Derivative Financial Instruments” for further information on the estimates and assumptions that
affect the amounts reported above.
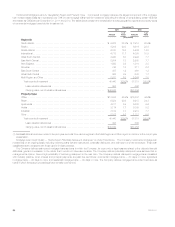
Credit Risk. See Note 4 of the Notes to Consolidated Financial Statements for information about how the Company manages credit risk related to
its freestanding derivatives, including the use of master netting agreements and collateral arrangements.
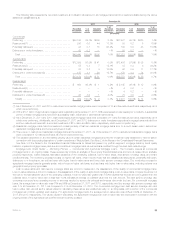
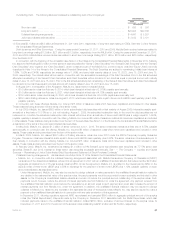
The Company’s policy is not to offset the fair value amounts recognized for derivatives executed with the same counterparty under the same master
netting agreement. This policy applies to the recognition of derivatives in the consolidated balance sheets, and does not affect the Company’s legal right
of offset. The estimated fair value of the Company’s net derivative assets and net derivative liabilities after the application of master netting agreements
and collateral were as follows at December 31, 2011:
December 31, 2011
Net Derivative
Assets Net Derivative
Liabilities
(In millions)
Estimated Fair Value of OTC Derivatives After Application of Master Netting Agreements (1) ........ $12,905 $ 619
Cash collateral on OTC Derivatives .................................................... (9,493) (8)
Estimated Fair Value of OTC Derivatives After Application of Master Netting Agreements and Cash
Collateral(1) .................................................................... 3,412 611
Securities Collateral on OTC Derivatives(2) .............................................. (2,520) (416)
Estimated Fair Value of OTC Derivatives After Application of Master Netting Agreements and Cash
and Securities Collateral(1) ......................................................... 892 195
Estimated Fair Value of Exchange-Traded Derivatives ...................................... 54 30
Total Estimated Fair Value of Derivatives After Application of Master Netting Agreements and Cash
and Securities Collateral(1) ....................................................... $ 946 $225
(1) Includes income accruals on derivatives.
(2) The collateral is held in separate custodial accounts and is not recorded on the Company’s consolidated balance sheets.
Credit Derivatives. See Note 4 of the Notes to Consolidated Financial Statements for information about the estimated fair value and maximum
amount at risk related to the Company’s written credit default swaps.
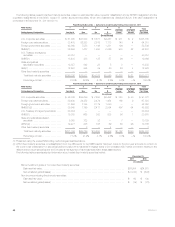
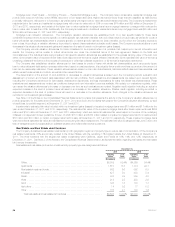
Embedded Derivatives. The embedded derivatives measured at estimated fair value on a recurring basis and their corresponding fair value
hierarchy, are presented as follows:
December 31, 2011
Net Embedded Derivatives Within
Asset Host
Contracts Liability Host
Contracts
(In millions)
Quoted prices in active markets for identical assets and liabilities (Level 1) ................. $ — —% $ — —%
Significant other observable inputs (Level 2) ......................................... 1 1 19 1
Significant unobservable inputs (Level 3) ........................................... 362 99 4,565 99
Total estimated fair value ...................................................... $363 100% $4,584 100%
58 MetLife, Inc.