MetLife 2011 Annual Report Download - page 79
Download and view the complete annual report
Please find page 79 of the 2011 MetLife annual report below. You can navigate through the pages in the report by either clicking on the pages listed below, or by using the keyword search tool below to find specific information within the annual report.-
 1
1 -
2
-
3
-
4
-
5
-
6
-
7
-
8
-
9
-
10
-
11
-
12
-
13
-
14
-
15
-
16
-
17
-
18
-
19
-
20
-
21
-
22
-
23
-
24
-
25
-
26
-
27
-
28
-
29
-
30
-
31
-
32
-
33
-
34
-
35
-
36
-
37
-
38
-
39
-
40
-
41
-
42
-
43
-
44
-
45
-
46
-
47
-
48
-
49
-
50
-
51
-
52
-
53
-
54
-
55
-
56
-
57
-
58
-
59
-
60
-
61
-
62
-
63
-
64
-
65
-
66
-
67
-
68
-
 69
69 -
 70
70 -
 71
71 -
 72
72 -
 73
73 -
 74
74 -
 75
75 -
 76
76 -
 77
77 -
 78
78 -
 79
79 -
 80
80 -
 81
81 -
 82
82 -
 83
83 -
 84
84 -
 85
85 -
 86
86 -
 87
87 -
 88
88 -
 89
89 -
90
-
91
-
92
-
93
-
94
-
95
-
96
-
97
-
98
-
99
-
100
-
101
-
102
-
103
-
104
-
105
-
106
-
107
-
108
-
109
-
110
-
111
-
112
-
113
-
114
-
115
-
116
-
117
-
118
-
119
-
120
-
121
-
122
-
123
-
124
-
125
-
126
-
127
-
128
-
129
-
130
-
131
-
132
-
133
-
134
-
135
-
136
-
137
-
138
-
139
-
140
-
141
-
142
-
143
-
144
-
145
-
146
-
147
-
148
-
149
-
150
-
151
-
152
-
153
-
154
-
155
-
156
-
157
-
158
-
159
-
160
-
161
-
162
-
163
-
164
-
165
-
166
-
167
-
168
-
169
-
170
-
171
-
172
-
173
-
174
-
175
-
176
-
177
-
178
-
179
-
180
-
181
-
182
-
183
-
184
-
185
-
186
-
187
-
188
-
189
-
190
-
191
-
192
-
193
-
194
-
195
-
196
-
197
-
198
-
199
-
200
-
201
-
202
-
203
-
204
-
205
-
206
-
207
-
208
-
209
-
210
-
211
-
212
-
213
-
214
-
215
-
216
-
217
-
218
-
219
-
220
-
221
-
222
-
223
-
224
-
225
-
226
-
227
-
228
-
229
-
230
-
231
-
232
-
233
-
234
-
235
-
236
-
237
-
238
-
239
-
240
-
241
-
242
-
243
 |
 |

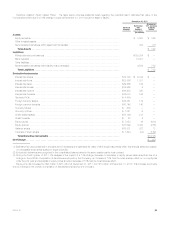
dividends previously paid over rolling 12-month periods, if paid before a specified date during 2012, some or all of such dividends may require
regulatory approval.
(2) All amounts paid, including those requiring regulatory approval.
(3) Reflects dividend amounts that could have been paid during the relevant year without prior regulatory approval.
(4) Includes securities transferred to MetLife, Inc. of $170 million and $399 million during the years ended December 31, 2011 and 2010, respectively.
(5) Reflects approximate dividend amounts permitted to be paid without prior regulatory approval.
(6) Reflects the respective dividends paid since the Acquisition Date. See Note 2 of the Notes to the Consolidated Financial Statements.
(7) Includes shares of an affiliate distributed to MetLife, Inc. as an in-kind dividend of $475 million.
In addition to the amounts presented in the table above, for the years ended December 31, 2011, 2010 and 2009, cash dividends in the aggregate
amount of $139 million, $0 and $215 million, respectively, were paid to MetLife, Inc. by certain of its other subsidiaries. Additionally, for the years ended
December 31, 2011, 2010 and 2009, MetLife, Inc. received cash of $771 million, $54 million and $0, respectively, representing returns of capital.
The dividend capacity of our non-U.S. operations is subject to similar restrictions established by the local regulators. The non-U.S. regulatory
regimes also commonly limit the dividend payments to the parent to a portion of the prior year’s statutory income, as determined by the local accounting
principles. The regulators of our non-U.S. operations, including Japan’s Financial Services Agency, may also limit or not permit profit repatriations or
other transfers of funds to the U.S. if such transfers are deemed to be detrimental to the solvency or financial strength of the non-U.S. operations, or for
other reasons. Most of the non-U.S. subsidiaries are second tier subsidiaries which are owned by various non-U.S. holding companies. The capital and
rating considerations applicable to the first tier subsidiaries may also impact the dividend flow into MetLife, Inc.
The Company’s management actively manages its target and excess capital levels and dividend flows on a proactive basis and forecasts local
capital positions as part of the financial planning cycle. The dividend capacity of certain U.S. and non-U.S. subsidiaries is also subject to business
targets in excess of the minimum capital necessary to maintain the desired rating or level of financial strength in the relevant market. Management of
MetLife, Inc. cannot provide assurances that MetLife, Inc.’s subsidiaries will have statutory earnings to support payment of dividends to MetLife, Inc. in
an amount sufficient to fund its cash requirements and pay cash dividends and that the applicable regulators will not disapprove any dividends that such
subsidiaries must submit for approval. See Note 18 of the Notes to the Consolidated Financial Statements.
Liquid Assets. An integral part of MetLife, Inc.’s liquidity management is the amount of liquid assets it holds. Liquid assets include cash and cash
equivalents, short-term investments and publicly-traded securities, excluding: (i) cash collateral received under the Company’s securities lending
program that has been reinvested in cash and cash equivalents, short-term investments and publicly-traded securities; and (ii) cash collateral received
from counterparties in connection with derivative instruments. At December 31, 2011 and 2010, MetLife, Inc. had $4.2 billion and $2.8 billion,
respectively, in liquid assets. In addition, MetLife, Inc. has pledged collateral and has had collateral pledged to it, and may be required from time to time
to pledge additional collateral or be entitled to have additional collateral pledged to it. At December 31, 2011 and 2010, MetLife, Inc. had pledged
$449 million and $362 million, respectively, of liquid assets under collateral support agreements.
Dispositions. Cash proceeds from dispositions during the years ended December 31, 2011, 2010 and 2009 were $180 million, $0 and
$130 million, respectively. See Note 2 of the Notes to the Consolidated Financial Statements for information regarding certain of these dispositions.
Global Funding Sources. Liquidity is also provided by a variety of short-term instruments, including commercial paper. Capital is provided by a
variety of instruments, including medium- and long-term debt, junior subordinated debt securities, collateral financing arrangements, capital securities
and stockholders’ equity. The diversity of MetLife, Inc.’s funding sources enhances funding flexibility, limits dependence on any one source of funds and
generally lowers the cost of funds. Other sources of MetLife, Inc.’s liquidity include programs for short-term and long-term borrowing, as needed.
We continuously monitor and adjust our liquidity and capital plans in light of changing requirements and market conditions.
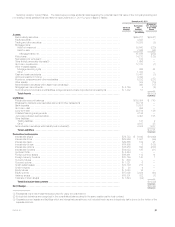
Long-term Debt. The following table summarizes the outstanding long-term debt of MetLife, Inc. at:
December 31,
2011 2010
(In millions)
Long-term debt — unaffiliated ............................................................. $15,666 $16,258
Long-term debt — affiliated(1) ............................................................. $ 500 $ 665
Collateral financing arrangements ........................................................... $ 2,797 $ 2,797
Junior subordinated debt securities ......................................................... $ 1,748 $ 1,748
(1) Includes $165 million of affiliated senior notes associated with bonds held by ALICO at December 31, 2010. Such bonds were sold to a third party
in the second quarter of 2011.
Short-term Debt. MetLife, Inc. maintains a commercial paper program, proceeds of which can be used to finance the general liquidity needs of
MetLife, Inc. and its subsidiaries. MetLife, Inc. had no short-term debt outstanding at both December 31, 2011 and 2010. There was no short-term
debt activity in both 2011 and 2010. During the year ended December 31, 2009, the weighted average interest rate on short-term debt, comprised only
of commercial paper, was 1.25%. During the year ended December 31, 2009, the average daily balance on short-term debt was $5 million, and the
average days outstanding was six days.
Debt Issuances and Other Borrowings. For information on MetLife, Inc.’s debt issuances and other borrowings, see “— The Company — Liquidity
and Capital Sources — Debt Issuances and Other Borrowings.”
MetLife, Inc. 75