MetLife 2011 Annual Report Download - page 57
Download and view the complete annual report
Please find page 57 of the 2011 MetLife annual report below. You can navigate through the pages in the report by either clicking on the pages listed below, or by using the keyword search tool below to find specific information within the annual report.-
 1
1 -
2
-
3
-
4
-
5
-
6
-
7
-
8
-
9
-
10
-
11
-
12
-
13
-
14
-
15
-
16
-
17
-
18
-
19
-
20
-
21
-
22
-
23
-
24
-
25
-
26
-
27
-
28
-
29
-
30
-
31
-
32
-
33
-
34
-
35
-
36
-
37
-
38
-
39
-
40
-
41
-
42
-
43
-
44
-
45
-
46
-
 47
47 -
 48
48 -
 49
49 -
 50
50 -
 51
51 -
 52
52 -
 53
53 -
 54
54 -
 55
55 -
 56
56 -
 57
57 -
 58
58 -
 59
59 -
 60
60 -
 61
61 -
 62
62 -
 63
63 -
 64
64 -
 65
65 -
 66
66 -
 67
67 -
68
-
69
-
70
-
71
-
72
-
73
-
74
-
75
-
76
-
77
-
78
-
79
-
80
-
81
-
82
-
83
-
84
-
85
-
86
-
87
-
88
-
89
-
90
-
91
-
92
-
93
-
94
-
95
-
96
-
97
-
98
-
99
-
100
-
101
-
102
-
103
-
104
-
105
-
106
-
107
-
108
-
109
-
110
-
111
-
112
-
113
-
114
-
115
-
116
-
117
-
118
-
119
-
120
-
121
-
122
-
123
-
124
-
125
-
126
-
127
-
128
-
129
-
130
-
131
-
132
-
133
-
134
-
135
-
136
-
137
-
138
-
139
-
140
-
141
-
142
-
143
-
144
-
145
-
146
-
147
-
148
-
149
-
150
-
151
-
152
-
153
-
154
-
155
-
156
-
157
-
158
-
159
-
160
-
161
-
162
-
163
-
164
-
165
-
166
-
167
-
168
-
169
-
170
-
171
-
172
-
173
-
174
-
175
-
176
-
177
-
178
-
179
-
180
-
181
-
182
-
183
-
184
-
185
-
186
-
187
-
188
-
189
-
190
-
191
-
192
-
193
-
194
-
195
-
196
-
197
-
198
-
199
-
200
-
201
-
202
-
203
-
204
-
205
-
206
-
207
-
208
-
209
-
210
-
211
-
212
-
213
-
214
-
215
-
216
-
217
-
218
-
219
-
220
-
221
-
222
-
223
-
224
-
225
-
226
-
227
-
228
-
229
-
230
-
231
-
232
-
233
-
234
-
235
-
236
-
237
-
238
-
239
-
240
-
241
-
242
-
243
 |
 |
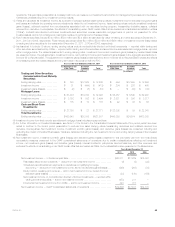
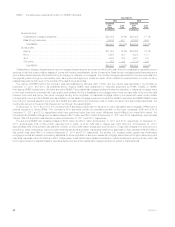
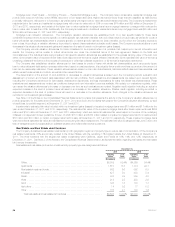
Explanations of changes in fixed maturity and equity securities impairments are as follows:
‰Year Ended December 31, 2011 compared to the Year Ended December 31, 2010 — Overall OTTI losses recognized in earnings on fixed
maturity and equity securities were $1.0 billion for the current year as compared to $484 million in the prior year. The increase in OTTI losses on
fixed maturity and equity securities primarily reflects impairments on Greece sovereign debt securities of $405 million as a result of the reduction in
the expected recoverable amount (see “— Investments — Current Environment”) and intent-to-sell fixed maturity security impairments on other
sovereign debt securities due to the repositioning of the acquired ALICO portfolio into longer duration and higher yielding investments, resulting in
total sovereign debt security impairments of $486 million recognized in 2011. In addition, intent-to-sell impairments related to the Divested
Businesses of $154 million were recognized in 2011 primarily concentrated in the RMBS sector. These increased impairments were partially offset
by decreased impairments in the CMBS, ABS and corporate sectors, reflecting improving economic fundamentals.
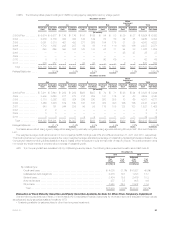
‰Year Ended December 31, 2010 compared to the Year Ended December 31, 2009 — Overall OTTI losses recognized in earnings on fixed
maturity and equity securities were $484 million for the year ended December 31, 2010 compared to $1.9 billion in the prior year. Improving or
stabilizing market conditions across all sectors and industries, particularly the financial services industry, as compared to the prior year when there
was significant stress in the global financial markets, resulted in a lower level of impairments in fixed maturity and equity securities in 2010. The
most significant decrease in the current year, as compared to the prior year, was in the Company’s financial services industry holdings which
comprised $799 million in fixed maturity and equity security impairments in the year ended December 31, 2009, as compared to $129 million in
impairments in the year ended December 31, 2010. Of the $799 million in financial services industry impairments in the prior year, $340 million
were in equity securities, of which $310 million were in financial services industry perpetual hybrid securities which were impaired as a result of
deterioration in the credit rating of the issuer to below investment grade and due to a severe and extended unrealized loss position on these
securities. Impairments in the current year were concentrated in the RMBS, ABS and CMBS sectors reflecting then current economic conditions
including higher unemployment levels and continued weakness within the real estate markets. Of the fixed maturity and equity securities
impairments of $484 million and $1.9 billion in the years ended December 31, 2010 and 2009, respectively, $287 million and $449 million, or
59% and 24%, respectively, were in the Company’s RMBS, ABS and CMBS holdings.
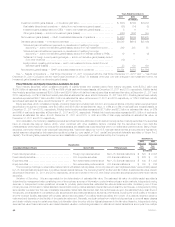
Future Impairments. Future OTTIs will depend primarily on economic fundamentals, issuer performance (including changes in the present value of
future cash flows expected to be collected), changes in credit ratings, changes in collateral valuation, changes in interest rates and changes in credit
spreads. If economic fundamentals or any of the above factors deteriorate, additional OTTIs may be incurred in upcoming quarters.
Credit Loss Rollforward — Rollforward of the Cumulative Credit Loss Component of OTTI Loss Recognized in Earnings on
Fixed Maturity Securities Still Held for Which a Portion of the OTTI Loss Was Recognized in Other Comprehensive Income
(Loss)
See Note 3 of the Notes to the Consolidated Financial Statements for the table that presents a rollforward of the cumulative credit loss component of
OTTI loss recognized in earnings on fixed maturity securities still held at December 31, 2011 and 2010 for which a portion of the OTTI loss was
recognized in other comprehensive income (loss) for the years ended December 31, 2011 and 2010.
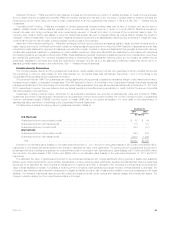
Securities Lending
The Company participates in a securities lending program whereby blocks of securities, which are included in fixed maturity securities and short-term
investments, are loaned to third parties, primarily brokerage firms and commercial banks. The Company obtains collateral, usually cash, in an amount
generally equal to 102% of the estimated fair value of the securities loaned, which is obtained at the inception of a loan and maintained at a level greater
than or equal to 100% for the duration of the loan. Securities loaned under such transactions may be sold or repledged by the transferee. The Company
is liable to return to its counterparties the cash collateral under its control. These transactions are treated as financing arrangements and the associated
liability is recorded at the amount of the cash received.
See Note 3 of the Notes to the Consolidated Financial Statements for the following information regarding the Company’s securities lending program:
securities on loan, cash collateral on deposit from counterparties, security collateral on deposit from counterparties and the estimated fair value of the
reinvestment portfolio at December 31, 2011 and 2010.
Invested Assets on Deposit, Held in Trust and Pledged as Collateral
See Note 3 of the Notes to the Consolidated Financial Statements for a table of the invested assets on deposit, held in trust and pledged as
collateral at December 31, 2011 and 2010.
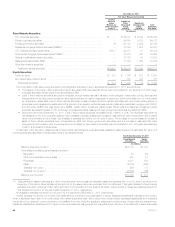
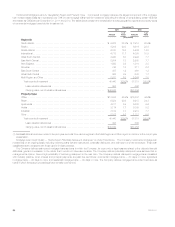
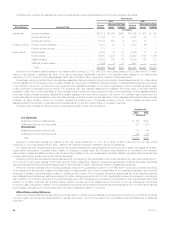
Mortgage Loans
The Company’s mortgage loans are principally collateralized by commercial real estate, agricultural real estate and residential properties. The carrying
value of mortgage loans was $72.1 billion and $62.3 billion, or 13.8% and 13.1% of total cash and invested assets at December 31, 2011 and 2010,
respectively. See Note 3 of the Notes to the Consolidated Financial Statements for a table that presents the Company’s mortgage loans
held-for-investment of $56.9 billion and $59.0 billion by portfolio segment at December 31, 2011 and 2010, respectively, as well as the components of
the mortgage loans held-for-sale of $15.2 billion and $3.3 billion at December 31, 2011 and 2010, respectively. The information presented below
excludes the effects of consolidating certain VIEs that are treated as CSEs and securitized reverse residential mortgage loans. Such amounts are
presented in the aforementioned table.
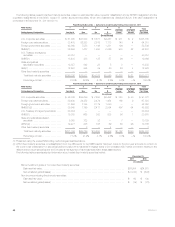
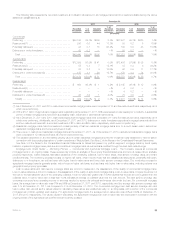
The Company diversifies its mortgage loan portfolio by both geographic region and property type to reduce the risk of concentration. Of the
Company’s commercial and agricultural mortgage loans, 90% are collateralized by properties located in the U.S., with the remaining 10% collateralized
by properties located outside the U.S., calculated as a percent of the total mortgage loans held - for- investment (excluding commercial mortgage loans
held by CSEs) at December 31, 2011. The carrying value of the Company’s commercial and agricultural mortgage loans located in California, New York
and Texas were 19%, 10% and 8%, respectively, of total mortgage loans held for investment (excluding commercial mortgage loans held by CSEs) at
December 31, 2011. Additionally, the Company manages risk when originating commercial and agricultural mortgage loans by generally lending only up
to 75% of the estimated fair value of the underlying real estate collateral.
MetLife, Inc. 53