MetLife 2011 Annual Report Download - page 41
Download and view the complete annual report
Please find page 41 of the 2011 MetLife annual report below. You can navigate through the pages in the report by either clicking on the pages listed below, or by using the keyword search tool below to find specific information within the annual report.-
 1
1 -
2
-
3
-
4
-
5
-
6
-
7
-
8
-
9
-
10
-
11
-
12
-
13
-
14
-
15
-
16
-
17
-
18
-
19
-
20
-
21
-
22
-
23
-
24
-
25
-
26
-
27
-
28
-
29
-
30
-
 31
31 -
 32
32 -
 33
33 -
 34
34 -
 35
35 -
 36
36 -
 37
37 -
 38
38 -
 39
39 -
 40
40 -
 41
41 -
 42
42 -
 43
43 -
 44
44 -
 45
45 -
 46
46 -
 47
47 -
 48
48 -
 49
49 -
 50
50 -
 51
51 -
52
-
53
-
54
-
55
-
56
-
57
-
58
-
59
-
60
-
61
-
62
-
63
-
64
-
65
-
66
-
67
-
68
-
69
-
70
-
71
-
72
-
73
-
74
-
75
-
76
-
77
-
78
-
79
-
80
-
81
-
82
-
83
-
84
-
85
-
86
-
87
-
88
-
89
-
90
-
91
-
92
-
93
-
94
-
95
-
96
-
97
-
98
-
99
-
100
-
101
-
102
-
103
-
104
-
105
-
106
-
107
-
108
-
109
-
110
-
111
-
112
-
113
-
114
-
115
-
116
-
117
-
118
-
119
-
120
-
121
-
122
-
123
-
124
-
125
-
126
-
127
-
128
-
129
-
130
-
131
-
132
-
133
-
134
-
135
-
136
-
137
-
138
-
139
-
140
-
141
-
142
-
143
-
144
-
145
-
146
-
147
-
148
-
149
-
150
-
151
-
152
-
153
-
154
-
155
-
156
-
157
-
158
-
159
-
160
-
161
-
162
-
163
-
164
-
165
-
166
-
167
-
168
-
169
-
170
-
171
-
172
-
173
-
174
-
175
-
176
-
177
-
178
-
179
-
180
-
181
-
182
-
183
-
184
-
185
-
186
-
187
-
188
-
189
-
190
-
191
-
192
-
193
-
194
-
195
-
196
-
197
-
198
-
199
-
200
-
201
-
202
-
203
-
204
-
205
-
206
-
207
-
208
-
209
-
210
-
211
-
212
-
213
-
214
-
215
-
216
-
217
-
218
-
219
-
220
-
221
-
222
-
223
-
224
-
225
-
226
-
227
-
228
-
229
-
230
-
231
-
232
-
233
-
234
-
235
-
236
-
237
-
238
-
239
-
240
-
241
-
242
-
243
 |
 |

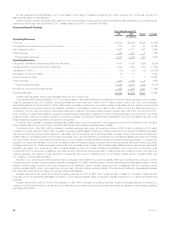
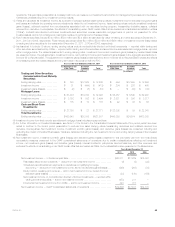
other than Japan from the Acquisition Date through November 30, 2010, which contributed $20 million to our 2010 operating earnings. As previously
noted, ALICO’s fiscal year-end is November 30; therefore, our results for the year include one month of results from ALICO operations other than Japan.
Changes in assumptions for measuring the impact of inflation on certain inflation-indexed fixed maturity securities increased operating earnings.
Changes to the provision for income taxes in both periods contributed to an increase in operating earnings, resulting from an unfavorable impact in 2009
from a change in assumption regarding the repatriation of earnings and a benefit in the current year from additional permanent reinvestment of earnings,
the reversal of tax provisions and favorable changes in liabilities for tax uncertainties. Business growth in our Latin America operation contributed to an
increase in operating earnings. Operating earnings in Mexico increased due to growth in our institutional and individual businesses, partially offset by the
impact of unfavorable claims experience. Higher investment yields resulting from portfolio restructuring was the primary driver in Argentina contributing to
an improvement in operating earnings. India’s results benefited primarily due to lower expenses resulting from the loss of a major distributor and slower
growth resulting from market conditions.
Partially offsetting these increases is the impact of pesification in Argentina, which favorably impacted 2009 reported earnings by $95 million. This
prior period benefit was due to a liability release resulting from a reassessment of our approach in managing existing and potential future claims related
to certain social security pension annuity contractholders in Argentina. In addition, operating earnings in Australia were lower, which was primarily due to
a write-off of DAC attributable to a change in a product feature in the current period.
Net investment income increased from growth in average invested assets and improved yields. Growth in average invested assets reflects growth in
our businesses. Improved yields reflects the impact of increased inflation, primarily in Chile, as well as the impact of changes in assumptions for
measuring the effects of inflation on certain inflation-indexed fixed maturity securities. The increase in net investment income from higher inflation was
offset by an increase in the related insurance liabilities due to higher inflation. Although diversification into higher yielding investments had a positive
impact on yields, this was partially offset by decreased trading and other securities results driven by a stronger recovery in equity markets in 2009
compared to 2010, primarily in Hong Kong, and by a decrease in the results of our operating joint ventures. The reduction in net investment income
from our trading portfolio is entirely offset by a corresponding decrease in the interest credited on the related contractholder account balances and
therefore had no impact on operating earnings.
In addition to an increase associated with the Acquisition, operating expenses increased due to the impact of the pesification in Argentina noted
above, as well as current period business growth in Korea, Brazil and Mexico, which resulted in increased commissions and compensation. These
increases were partially offset by lower commissions and business expenses in India.
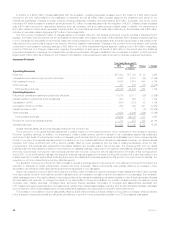
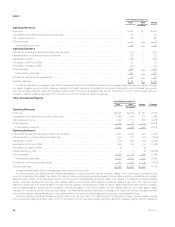
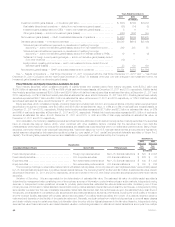
Corporate & Other
Years Ended December 31,
2010 2009 Change % Change
(In millions)
Operating Revenues
Premiums .......................................................................... $ 11 $ 19 $ (8) (42.1)%
Net investment income ............................................................... 643 70 573
Other revenues ..................................................................... 391 236 155 65.7%
Total operating revenues ............................................................ 1,045 325 720
Operating Expenses
Policyholder benefits and claims and policyholder dividends ................................... (14) 4 (18)
Amortization of DAC and VOBA ......................................................... 1 3 (2) (66.7)%
Interest expense on debt .............................................................. 1,126 1,027 99 9.6%
Other expenses ..................................................................... 467 586 (119) (20.3)%
Total operating expenses ............................................................ 1,580 1,620 (40) (2.5)%
Provision for income tax expense (benefit) ................................................. (366) (756) 390 51.6%
Operating earnings ................................................................... (169) (539) 370 68.6%
Less: Preferred stock dividends ......................................................... 122 122 — —%
Operating earnings (losses) available to common shareholders ................................ $ (291) $ (661) $ 370 56.0%
Unless otherwise stated, all amounts discussed below are net of income tax.
MetLife, Inc. completed four debt financings in August 2010 in anticipation of the Acquisition, issuing $1.0 billion of 2.375% senior notes, $1.0 billion
of 4.75% senior notes, $750 million of 5.875% senior notes, and $250 million of floating rate senior notes. MetLife, Inc. also issued debt securities,
which are part of the $3.0 billion stated value of common equity units. The proceeds from these debt issuances were used to finance the Acquisition.
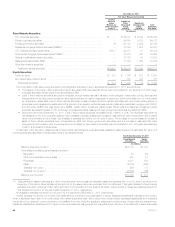
MetLife, Inc. completed three debt issuances in 2009 in response to the economic crisis, issuing $397 million of floating rate senior notes in March
2009, $1.3 billion of senior notes in May 2009, and $500 million of junior subordinated debt securities in July 2009. The proceeds from these debt
issuances were used for general corporate purposes.
Operating earnings available to common shareholders and operating earnings, which excludes preferred stock dividends, each increased
$370 million, primarily due to an increase in net investment income and a reduction in operating expenses, partially offset by a decrease in tax benefit
and an increase in interest expense resulting from the debt issuances noted above.
Net investment income increased $372 million reflecting an increase of $242 million due to higher yields and an increase of $130 million from growth
in average invested assets. Yields were positively impacted by the effects of recovering private equity markets and stabilizing real estate markets on
other limited partnership interests and real estate joint ventures. This was partially offset by lower fixed maturities and mortgage loan yields which were
adversely impacted by the reinvestment of proceeds from maturities and sales during this lower interest rate environment and from decreased trading
and other securities results due to a stronger recovery in equity markets in 2009 as compared to 2010. In addition, due to the lower interest rate
environment in the current year, less net investment income was credited to the segments in 2010 compared to 2009. Growth in average invested
assets was primarily due to higher cash collateral balances received from our derivative counterparties and the temporary investment of the proceeds
from the debt and common stock issuances in anticipation of the Acquisition. Our investments primarily include structured finance securities, investment
MetLife, Inc. 37