MetLife 2011 Annual Report Download - page 40
Download and view the complete annual report
Please find page 40 of the 2011 MetLife annual report below. You can navigate through the pages in the report by either clicking on the pages listed below, or by using the keyword search tool below to find specific information within the annual report.-
 1
1 -
2
-
3
-
4
-
5
-
6
-
7
-
8
-
9
-
10
-
11
-
12
-
13
-
14
-
15
-
16
-
17
-
18
-
19
-
20
-
21
-
22
-
23
-
24
-
25
-
26
-
27
-
28
-
29
-
 30
30 -
 31
31 -
 32
32 -
 33
33 -
 34
34 -
 35
35 -
 36
36 -
 37
37 -
 38
38 -
 39
39 -
 40
40 -
 41
41 -
 42
42 -
 43
43 -
 44
44 -
 45
45 -
 46
46 -
 47
47 -
 48
48 -
 49
49 -
 50
50 -
51
-
52
-
53
-
54
-
55
-
56
-
57
-
58
-
59
-
60
-
61
-
62
-
63
-
64
-
65
-
66
-
67
-
68
-
69
-
70
-
71
-
72
-
73
-
74
-
75
-
76
-
77
-
78
-
79
-
80
-
81
-
82
-
83
-
84
-
85
-
86
-
87
-
88
-
89
-
90
-
91
-
92
-
93
-
94
-
95
-
96
-
97
-
98
-
99
-
100
-
101
-
102
-
103
-
104
-
105
-
106
-
107
-
108
-
109
-
110
-
111
-
112
-
113
-
114
-
115
-
116
-
117
-
118
-
119
-
120
-
121
-
122
-
123
-
124
-
125
-
126
-
127
-
128
-
129
-
130
-
131
-
132
-
133
-
134
-
135
-
136
-
137
-
138
-
139
-
140
-
141
-
142
-
143
-
144
-
145
-
146
-
147
-
148
-
149
-
150
-
151
-
152
-
153
-
154
-
155
-
156
-
157
-
158
-
159
-
160
-
161
-
162
-
163
-
164
-
165
-
166
-
167
-
168
-
169
-
170
-
171
-
172
-
173
-
174
-
175
-
176
-
177
-
178
-
179
-
180
-
181
-
182
-
183
-
184
-
185
-
186
-
187
-
188
-
189
-
190
-
191
-
192
-
193
-
194
-
195
-
196
-
197
-
198
-
199
-
200
-
201
-
202
-
203
-
204
-
205
-
206
-
207
-
208
-
209
-
210
-
211
-
212
-
213
-
214
-
215
-
216
-
217
-
218
-
219
-
220
-
221
-
222
-
223
-
224
-
225
-
226
-
227
-
228
-
229
-
230
-
231
-
232
-
233
-
234
-
235
-
236
-
237
-
238
-
239
-
240
-
241
-
242
-
243
 |
 |

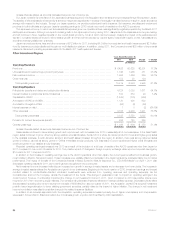
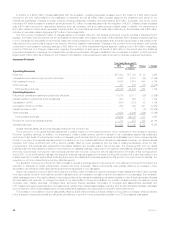
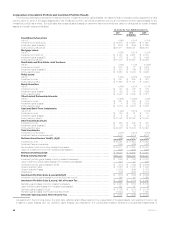
Japan
Years Ended December 31,
Change2010 2009
(In millions)
Operating Revenues
Premiums ................................................................................... $499 $— $499
Universal life and investment-type product policy fees ................................................. 55 — 55
Net investment income ......................................................................... 145 — 145
Other revenues ............................................................................... 7 — 7
Total operating revenues ...................................................................... 706 — 706
Operating Expenses
Policyholder benefits and claims and policyholder dividends ............................................ 309 — 309
Interest credited to policyholder account balances .................................................... 123 — 123
Capitalization of DAC .......................................................................... (149) — (149)
Amortization of DAC and VOBA .................................................................. 82 — 82
Amortization of negative VOBA ................................................................... (49) — (49)
Other expenses .............................................................................. 244 — 244
Total operating expenses ..................................................................... 560 — 560
Provision for income tax expense (benefit) .......................................................... 52 — 52
Operating earnings ............................................................................ $ 94 $— $ 94
Our Japan operation is comprised of the Japan business acquired in the Acquisition and is among the largest foreign life insurers in Japan. Through
our Japan operation we provide life insurance, accident and health insurance, annuities and endowment products to both individuals and groups.
Reported operating earnings reflect the operating results of ALICO from the Acquisition Date through November 30, 2010, ALICO’s fiscal year-end.
Therefore, Japan’s operating earnings for 2010 include one month of results from ALICO operations.
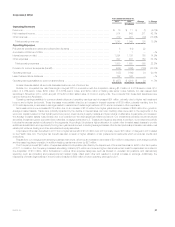
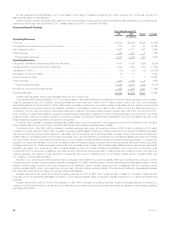
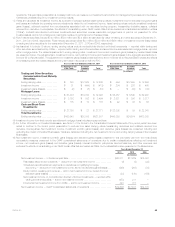
Other International Regions
Years Ended December 31,
Change % Change2010 2009
(In millions)
Operating Revenues
Premiums ......................................................................... $3,625 $2,884 $ 741 25.7%
Universal life and investment-type product policy fees ....................................... 1,265 1,055 210 19.9%
Net investment income ............................................................... 1,466 1,111 355 32.0%
Other revenues ..................................................................... 28 14 14 100.0%
Total operating revenues ............................................................ 6,384 5,064 1,320 26.1%
Operating Expenses
Policyholder benefits and claims and policyholder dividends .................................. 3,053 2,326 727 31.3%
Interest credited to policyholder account balances .......................................... 554 577 (23) (4.0)%
Capitalization of DAC ................................................................ (775) (587) (188) (32.0)%
Amortization of DAC and VOBA ........................................................ 490 397 93 23.4%
Amortization of negative VOBA ......................................................... (8) — (8)
Interest expense on debt ............................................................. 3 8 (5) (62.5)%
Other expenses .................................................................... 2,233 1,737 496 28.6%
Total operating expenses ........................................................... 5,550 4,458 1,092 24.5%
Provision for income tax expense (benefit) ................................................ 148 155 (7) (4.5)%
Operating earnings .................................................................. $ 686 $ 451 $ 235 52.1%
Unless otherwise stated, all amounts discussed below are net of income tax.
The improvement in the global financial markets has resulted in continued growth, with an increase in sales in the current period compared to the
prior period excluding the results of our Japan joint venture. Retirement and savings sales increased driven by strong annuity, universal life and pension
sales in Europe, Mexico, Chile, Korea and China. In our Europe and the Middle East operations, sales of annuities and universal life products remained
strong, more than doubling from the prior year, partially offset by lower pension and variable universal life sales in India due to the loss of a major
distributor, as well as lower credit life sales. Our Latin America operation experienced an overall increase in sales resulting from solid growth in pension
and universal life sales in Mexico and an increase in fixed annuity sales in Chile due to market recovery, slightly offset by lower bank sales in Brazil
resulting from incentives offered in the prior year. Sales in our Asia Pacific operation, excluding the results of our Japan joint venture, increased primarily
due to higher variable universal life sales in Korea, slightly offset by the decline in annuity sales and strong bank channel sales in China.
Reported operating earnings increased by $235 million over the prior year. The positive impact of changes in foreign currency exchange rates
improved reported earnings by $37 million for 2010 compared to 2009. Reported operating earnings reflect the operating results of ALICO operations
36 MetLife, Inc.