MetLife 2011 Annual Report Download - page 56
Download and view the complete annual report
Please find page 56 of the 2011 MetLife annual report below. You can navigate through the pages in the report by either clicking on the pages listed below, or by using the keyword search tool below to find specific information within the annual report.-
 1
1 -
2
-
3
-
4
-
5
-
6
-
7
-
8
-
9
-
10
-
11
-
12
-
13
-
14
-
15
-
16
-
17
-
18
-
19
-
20
-
21
-
22
-
23
-
24
-
25
-
26
-
27
-
28
-
29
-
30
-
31
-
32
-
33
-
34
-
35
-
36
-
37
-
38
-
39
-
40
-
41
-
42
-
43
-
44
-
45
-
 46
46 -
 47
47 -
 48
48 -
 49
49 -
 50
50 -
 51
51 -
 52
52 -
 53
53 -
 54
54 -
 55
55 -
 56
56 -
 57
57 -
 58
58 -
 59
59 -
 60
60 -
 61
61 -
 62
62 -
 63
63 -
 64
64 -
 65
65 -
 66
66 -
67
-
68
-
69
-
70
-
71
-
72
-
73
-
74
-
75
-
76
-
77
-
78
-
79
-
80
-
81
-
82
-
83
-
84
-
85
-
86
-
87
-
88
-
89
-
90
-
91
-
92
-
93
-
94
-
95
-
96
-
97
-
98
-
99
-
100
-
101
-
102
-
103
-
104
-
105
-
106
-
107
-
108
-
109
-
110
-
111
-
112
-
113
-
114
-
115
-
116
-
117
-
118
-
119
-
120
-
121
-
122
-
123
-
124
-
125
-
126
-
127
-
128
-
129
-
130
-
131
-
132
-
133
-
134
-
135
-
136
-
137
-
138
-
139
-
140
-
141
-
142
-
143
-
144
-
145
-
146
-
147
-
148
-
149
-
150
-
151
-
152
-
153
-
154
-
155
-
156
-
157
-
158
-
159
-
160
-
161
-
162
-
163
-
164
-
165
-
166
-
167
-
168
-
169
-
170
-
171
-
172
-
173
-
174
-
175
-
176
-
177
-
178
-
179
-
180
-
181
-
182
-
183
-
184
-
185
-
186
-
187
-
188
-
189
-
190
-
191
-
192
-
193
-
194
-
195
-
196
-
197
-
198
-
199
-
200
-
201
-
202
-
203
-
204
-
205
-
206
-
207
-
208
-
209
-
210
-
211
-
212
-
213
-
214
-
215
-
216
-
217
-
218
-
219
-
220
-
221
-
222
-
223
-
224
-
225
-
226
-
227
-
228
-
229
-
230
-
231
-
232
-
233
-
234
-
235
-
236
-
237
-
238
-
239
-
240
-
241
-
242
-
243
 |
 |

‰Net unrealized investment gains (losses);
‰Continuous gross unrealized losses and OTTI losses for fixed maturity and equity securities available-for-sale by sector;
‰Aging of gross unrealized losses and OTTI losses for fixed maturity and equity securities available-for-sale;
‰Concentration of gross unrealized losses and OTTI losses for fixed maturity and equity securities available-for-sale; and
‰Evaluating temporarily impaired available-for-sale securities.
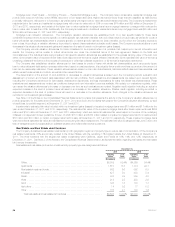
Trading and Other Securities
The Company has a trading securities portfolio, principally invested in fixed maturity securities, to support investment strategies that involve the active
and frequent purchase and sale of securities (“Actively Traded Securities”) and the execution of short sale agreements. Trading and other securities also
include securities for which the FVO has been elected (“FVO Securities”). FVO Securities include certain fixed maturity and equity securities held for
investment by the general account to support asset and liability matching strategies for certain insurance products. FVO Securities also include
contractholder-directed investments supporting unit-linked variable annuity type liabilities which do not qualify for presentation as separate account
summary total assets and liabilities. These investments are primarily mutual funds and, to a lesser extent, fixed maturity and equity securities, short-term
investments and cash and cash equivalents. The investment returns on these investments inure to contractholders and are offset by a corresponding
change in PABs through interest credited to policyholder account balances. FVO Securities also include securities held by CSEs (former qualifying
special purpose entities). Trading and other securities were $18.3 billion and $18.6 billion at estimated fair value, or 3.5% and 3.9% of total cash and
invested assets, at December 31, 2011 and 2010, respectively. See Note 3 of the Notes to the Consolidated Financial Statements for tables which
present information about the Actively Traded Securities and FVO Securities, related short sale agreement liabilities and investments pledged to secure
short sale agreement liabilities at December 31, 2011 and 2010.
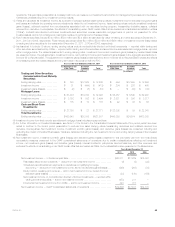
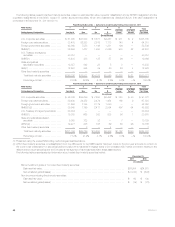
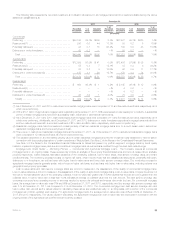
Trading and other securities and trading (short sale agreement) liabilities, measured at estimated fair value on a recurring basis and their
corresponding fair value hierarchy, are presented as follows:
December 31, 2011
Trading and Other
Securities Trading
Liabilities
(In millions)
Quoted prices in active markets for identical assets and liabilities (Level 1) ................ $ 7,572 41% $124 98%
Significant other observable inputs (Level 2) ........................................ 9,287 51 3 2
Significant unobservable inputs (Level 3) .......................................... 1,409 8 — —
Total estimated fair value ..................................................... $18,268 100% $127 100%
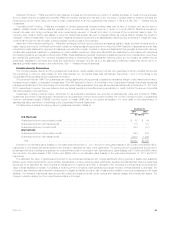
A rollforward of the fair value measurements for trading and other securities measured at estimated fair value on a recurring basis using significant
unobservable (Level 3) inputs for the year ended December 31, 2011, is as follows:
Year Ended
December 31, 2011
(In millions)
Balance, beginning of period .................................................................. $ 822
Total realized/unrealized gains (losses) included in earnings ......................................... (2)
Purchases ............................................................................... 1,246
Sales ................................................................................... (519)
Transfers into Level 3 ...................................................................... 121
Transfers out of Level 3 ..................................................................... (259)
Balance, end of period ....................................................................... $1,409
See “ — Summary of Critical Accounting Estimates” for further information on the estimates and assumptions that affect the amounts reported
above.
See Note 5 of the Notes to the Consolidated Financial Statements for further information about the valuation techniques and inputs by level of major
classes of invested assets that affect the amounts reported above.
Net Investment Gains (Losses) Including OTTI Losses Recognized in Earnings
See Note 3 of the Notes to the Consolidated Financial Statements for tables that present:
‰The components of net investment gains (losses) for the years ended December 31, 2011, 2010 and 2009;
‰Proceeds from sales or disposals of fixed maturity and equity securities and the components of fixed maturity and equity securities net investment
gains (losses) for the years ended December 31, 2011, 2010 and 2009;
‰Fixed maturity security OTTI losses recognized in earnings by sector and industry within the U.S. and foreign corporate securities sector for the
years ended December 31, 2011, 2010 and 2009; and
‰Equity security OTTI losses recognized in earnings by sector and industry for the years ended December 31, 2011, 2010 and 2009.
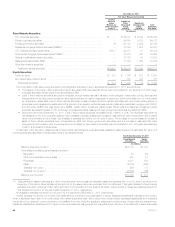
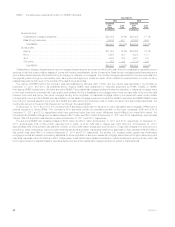
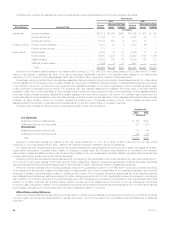
Overview of Fixed Maturity and Equity Security OTTI Losses Recognized in Earnings. Impairments of fixed maturity and equity securities were
$1.0 billion, $484 million and $1.9 billion for the years ended December 31, 2011, 2010 and 2009, respectively. Impairments of fixed maturity securities
were $955 million, $470 million and $1.5 billion for the years ended December 31, 2011, 2010 and 2009, respectively. Impairments of equity securities
were $60 million, $14 million and $400 million for the years ended December 31, 2011, 2010 and 2009, respectively.
The Company’s credit-related impairments of fixed maturity securities were $645 million, $423 million and $1.1 billion for the years ended
December 31, 2011, 2010 and 2009, respectively.
The Company’s three largest impairments totaled $499 million, $105 million and $508 million for the years ended December 31, 2011, 2010 and
2009, respectively.
The Company records OTTI losses charged to earnings within net investment gains (losses) and adjusts the cost basis of the fixed maturity and
equity securities accordingly. The Company does not change the revised cost basis for subsequent recoveries in value.
52 MetLife, Inc.