MetLife 2011 Annual Report Download - page 8
Download and view the complete annual report
Please find page 8 of the 2011 MetLife annual report below. You can navigate through the pages in the report by either clicking on the pages listed below, or by using the keyword search tool below to find specific information within the annual report.-
 1
1 -
 2
2 -
 3
3 -
 4
4 -
 5
5 -
 6
6 -
 7
7 -
 8
8 -
 9
9 -
 10
10 -
 11
11 -
 12
12 -
 13
13 -
 14
14 -
 15
15 -
 16
16 -
 17
17 -
 18
18 -
 19
19 -
20
-
21
-
22
-
23
-
24
-
25
-
26
-
27
-
28
-
29
-
30
-
31
-
32
-
33
-
34
-
35
-
36
-
37
-
38
-
39
-
40
-
41
-
42
-
43
-
44
-
45
-
46
-
47
-
48
-
49
-
50
-
51
-
52
-
53
-
54
-
55
-
56
-
57
-
58
-
59
-
60
-
61
-
62
-
63
-
64
-
65
-
66
-
67
-
68
-
69
-
70
-
71
-
72
-
73
-
74
-
75
-
76
-
77
-
78
-
79
-
80
-
81
-
82
-
83
-
84
-
85
-
86
-
87
-
88
-
89
-
90
-
91
-
92
-
93
-
94
-
95
-
96
-
97
-
98
-
99
-
100
-
101
-
102
-
103
-
104
-
105
-
106
-
107
-
108
-
109
-
110
-
111
-
112
-
113
-
114
-
115
-
116
-
117
-
118
-
119
-
120
-
121
-
122
-
123
-
124
-
125
-
126
-
127
-
128
-
129
-
130
-
131
-
132
-
133
-
134
-
135
-
136
-
137
-
138
-
139
-
140
-
141
-
142
-
143
-
144
-
145
-
146
-
147
-
148
-
149
-
150
-
151
-
152
-
153
-
154
-
155
-
156
-
157
-
158
-
159
-
160
-
161
-
162
-
163
-
164
-
165
-
166
-
167
-
168
-
169
-
170
-
171
-
172
-
173
-
174
-
175
-
176
-
177
-
178
-
179
-
180
-
181
-
182
-
183
-
184
-
185
-
186
-
187
-
188
-
189
-
190
-
191
-
192
-
193
-
194
-
195
-
196
-
197
-
198
-
199
-
200
-
201
-
202
-
203
-
204
-
205
-
206
-
207
-
208
-
209
-
210
-
211
-
212
-
213
-
214
-
215
-
216
-
217
-
218
-
219
-
220
-
221
-
222
-
223
-
224
-
225
-
226
-
227
-
228
-
229
-
230
-
231
-
232
-
233
-
234
-
235
-
236
-
237
-
238
-
239
-
240
-
241
-
242
-
243
 |
 |

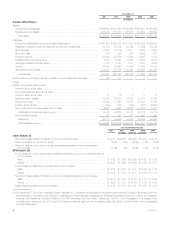
December 31,
2011 2010 2009 2008 2007
(In millions)
Balance Sheet Data(1)
Assets:
General account assets(2) ............................................... $596,602 $ 547,768 $ 390,460 $ 380,981 $ 399,099
Separate account assets ................................................ 203,023 183,138 148,854 120,697 160,050
Total assets ......................................................... $799,625 $ 730,906 $ 539,314 $ 501,678 $ 559,149
Liabilities:
Policyholder liabilities and other policy-related balances(3) ....................... $421,244 $ 399,125 $ 281,487 $ 280,345 $ 259,682
Payables for collateral under securities loaned and other transactions .............. 33,716 27,272 24,196 31,059 44,136
Bank deposits ......................................................... 10,507 10,316 10,211 6,884 4,534
Short-term debt ........................................................ 686 306 912 2,659 667
Long-term debt(2) ...................................................... 23,692 27,586 13,220 9,667 9,100
Collateral financing arrangements .......................................... 4,647 5,297 5,297 5,192 4,882
Junior subordinated debt securities ........................................ 3,192 3,191 3,191 3,758 4,075
Other(2) .............................................................. 38,642 25,562 18,448 17,432 35,038
Separate account liabilities ............................................... 203,023 183,138 148,854 120,697 160,050
Total liabilities ........................................................ 739,349 681,793 505,816 477,693 522,164
Redeemable noncontrolling interests in partially owned consolidated securities ......... 105 117 — — —
Equity:
MetLife, Inc.’s stockholders’ equity:
Preferred stock, at par value .............................................. 1 1 1 1 1
Convertible preferred stock, at par value ..................................... —————
Common stock, at par value .............................................. 11 10 8 8 8
Additional paid-in capital ................................................. 26,782 26,423 16,859 15,811 17,098
Retained earnings ...................................................... 27,289 21,363 19,501 22,403 19,884
Treasury stock, at cost .................................................. (172) (172) (190) (236) (2,890)
Accumulated other comprehensive income (loss) .............................. 5,886 1,000 (3,058) (14,253) 1,078
Total MetLife, Inc.’s stockholders’ equity ................................... 59,797 48,625 33,121 23,734 35,179
Noncontrolling interests .................................................. 374 371 377 251 1,806
Total equity ......................................................... 60,171 48,996 33,498 23,985 36,985
Total liabilities and equity ............................................... $799,625 $ 730,906 $ 539,314 $ 501,678 $ 559,149
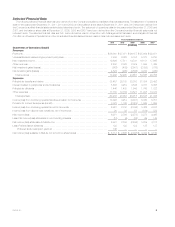
Years Ended December 31,
2011 2010 2009 2008 2007
(In millions, except per share data)
Other Data(1), (4)
Net income (loss) available to MetLife, Inc.’s common shareholders ..................... $6,713 $ 2,668 $(2,368) $ 3,084 $ 4,180
Return on MetLife, Inc.’s common equity .......................................... 12.8% 6.9% (9.0)% 11.2% 12.9%
Return on MetLife, Inc.’s common equity, excluding accumulated other comprehensive
income (loss) .............................................................. 13.8% 7.0% (6.8)% 9.1% 13.3%
EPS Data(1), (5)
Income (loss) from continuing operations available to MetLife, Inc.’s common shareholders per
common share:
Basic .................................................................... $ 6.32 $ 2.98 $ (2.96) $ 4.57 $ 5.30
Diluted ................................................................... $ 6.27 $ 2.96 $ (2.96) $ 4.52 $ 5.17
Income (loss) from discontinued operations per common share:
Basic .................................................................... $ 0.02 $ 0.04 $ 0.07 $ (0.38) $ 0.32
Diluted ................................................................... $ 0.02 $ 0.04 $ 0.07 $ (0.38) $ 0.31
Net income (loss) available to MetLife, Inc.’s common shareholders per common share:
Basic .................................................................... $ 6.34 $ 3.02 $ (2.89) $ 4.19 $ 5.62
Diluted ................................................................... $ 6.29 $ 3.00 $ (2.89) $ 4.14 $ 5.48
Cash dividends declared per common share ....................................... $ 0.74 $ 0.74 $ 0.74 $ 0.74 $ 0.74
(1) On November 1, 2010 (the “Acquisition Date”), MetLife, Inc. completed the acquisition of American Life Insurance Company (“American Life”) from
AM Holdings LLC (formerly known as ALICO Holdings LLC) (“AM Holdings”), a subsidiary of American International Group, Inc. (“AIG”), and Delaware
American Life Insurance Company (“DelAm”) from AIG (American Life with DelAm, collectively, “ALICO”) ( the “Acquisition”). The results of the
Acquisition are reflected in the 2011 and 2010 selected financial data from the Acquisition Date. See Note 2 of the Notes to the Consolidated
Financial Statements.
4MetLife, Inc.