MetLife 2013 Annual Report Download - page 90
Download and view the complete annual report
Please find page 90 of the 2013 MetLife annual report below. You can navigate through the pages in the report by either clicking on the pages listed below, or by using the keyword search tool below to find specific information within the annual report.
MetLife, Inc.
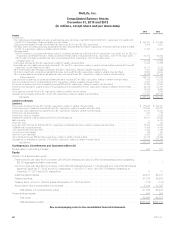
Consolidated Balance Sheets
December 31, 2013 and 2012
(In millions, except share and per share data)
2013 2012
Assets
Investments:
Fixed maturity securities available-for-sale, at estimated fair value (amortized cost: $333,599 and $340,870, respectively; includes $4,005
and $3,378, respectively, relating to variable interest entities) .............................................................. $ 350,187 $ 374,266
Equity securities available-for-sale, at estimated fair value (cost: $3,012 and $2,838, respectively) ................................... 3,402 2,891
Fair value option and trading securities, at estimated fair value (includes $662 and $659, respectively, of actively traded securities; and $92
and $112, respectively, relating to variable interest entities) ................................................................ 17,423 16,348
Mortgage loans:
Held-for-investment, principally at amortized cost (net of valuation allowances of $322 and $347, respectively; includes $1,621 and $2,715,
respectively, at estimated fair value, relating to variable interest entities; includes $338 and $0, respectively, under the fair value option) . . . 57,703 56,592
Held-for-sale, principally at estimated fair value (includes $0 and $49, respectively, under the fair value option) ........................ 3 414
Mortgage loans, net ............................................................................................. 57,706 57,006
Policy loans (includes $2 and $0, respectively, relating to variable interest entities) ............................................... 11,764 11,884
Real estate and real estate joint ventures (includes $1,141 and $10, respectively, relating to variable interest entities; includes $186 and $1,
respectively, of real estate held-for-sale) .............................................................................. 10,712 9,918
Other limited partnership interests (includes $53 and $274, respectively, relating to variable interest entities) ........................... 7,401 6,688
Short-term investments, principally at estimated fair value (includes $8 and $0, respectively, relating to variable interest entities) ............ 13,955 16,906
Other invested assets, principally at estimated fair value (includes $78 and $81, respectively, relating to variable interest entities) ........... 16,229 21,145
Total investments ............................................................................................ 488,779 517,052
Cash and cash equivalents, principally at estimated fair value (includes $70 and $99, respectively, relating to variable interest entities) ........ 7,585 15,738
Accrued investment income (includes $26 and $13, respectively, relating to variable interest entities) .................................. 4,255 4,374
Premiums, reinsurance and other receivables (includes $22 and $5, respectively, relating to variable interest entities) ..................... 21,859 21,634
Deferred policy acquisition costs and value of business acquired (includes $255 and $0, respectively, relating to variable interest entities) ..... 26,706 24,761
Goodwill ......................................................................................................... 10,542 9,953
Other assets (includes $152 and $5, respectively, relating to variable interest entities) .............................................. 8,369 7,876
Separate account assets (includes $1,033 and $0, respectively, relating to variable interest entities) .................................. 317,201 235,393
Total assets ................................................................................................. $ 885,296 $ 836,781
Liabilities and Equity
Liabilities
Future policy benefits (includes $516 and $0, respectively, relating to variable interest entities) ....................................... $ 187,942 $ 192,351
Policyholder account balances (includes $56 and $0, respectively, relating to variable interest entities) ................................. 212,885 225,821
Other policy-related balances (includes $123 and $0, respectively, relating to variable interest entities) ................................. 15,214 15,463
Policyholder dividends payable ........................................................................................ 675 728
Policyholder dividend obligation ........................................................................................ 1,771 3,828
Payables for collateral under securities loaned and other transactions .......................................................... 30,411 33,687
Bank deposits ..................................................................................................... — 6,416
Short-term debt .................................................................................................... 175 100
Long-term debt (includes $1,868 and $2,527, respectively, at estimated fair value, relating to variable interest entities) .................... 18,653 19,062
Collateral financing arrangements ...................................................................................... 4,196 4,196
Junior subordinated debt securities ..................................................................................... 3,193 3,192
Current income tax payable ........................................................................................... 186 401
Deferred income tax liability ........................................................................................... 6,643 8,693
Other liabilities (includes $88 and $40, respectively, relating to variable interest entities) ............................................ 23,168 22,492
Separate account liabilities (includes $1,033 and $0, respectively, relating to variable interest entities) ................................. 317,201 235,393
Total liabilities ................................................................................................ 822,313 771,823
Contingencies, Commitments and Guarantees (Note 21)
Redeemable noncontrolling interests ...................................................................... 887 121
Equity
MetLife, Inc.’s stockholders’ equity: .......................................................................
Preferred stock, par value $0.01 per share; 200,000,000 shares authorized: 84,000,000 shares issued and outstanding;
$2,100 aggregate liquidation preference ............................................................... 1 1
Common stock, par value $0.01 per share; 3,000,000,000 shares authorized; 1,125,224,024 and 1,094,880,623 shares
issued at December 31, 2013 and 2012, respectively; 1,122,030,137 and 1,091,686,736 shares outstanding at
December 31, 2013 and 2012, respectively ............................................................ 11 11
Additional paid-in capital .............................................................................. 29,277 28,011
Retained earnings ................................................................................... 27,332 25,205
Treasury stock, at cost; 3,193,887 shares at December 31, 2013 and 2012 ..................................... (172) (172)
Accumulated other comprehensive income (loss) .......................................................... 5,104 11,397
Total MetLife, Inc.’s stockholders’ equity .............................................................. 61,553 64,453
Noncontrolling interests ................................................................................ 543 384
Total equity .................................................................................... 62,096 64,837
Total liabilities and equity .......................................................................... $885,296 $836,781
See accompanying notes to the consolidated financial statements.
82 MetLife, Inc.


