MetLife 2013 Annual Report Download - page 58
Download and view the complete annual report
Please find page 58 of the 2013 MetLife annual report below. You can navigate through the pages in the report by either clicking on the pages listed below, or by using the keyword search tool below to find specific information within the annual report.-
 1
1 -
2
-
3
-
4
-
5
-
6
-
7
-
8
-
9
-
10
-
11
-
12
-
13
-
14
-
15
-
16
-
17
-
18
-
19
-
20
-
21
-
22
-
23
-
24
-
25
-
26
-
27
-
28
-
29
-
30
-
31
-
32
-
33
-
34
-
35
-
36
-
37
-
38
-
39
-
40
-
41
-
42
-
43
-
44
-
45
-
46
-
47
-
 48
48 -
 49
49 -
 50
50 -
 51
51 -
 52
52 -
 53
53 -
 54
54 -
 55
55 -
 56
56 -
 57
57 -
 58
58 -
 59
59 -
 60
60 -
 61
61 -
 62
62 -
 63
63 -
 64
64 -
 65
65 -
 66
66 -
 67
67 -
 68
68 -
69
-
70
-
71
-
72
-
73
-
74
-
75
-
76
-
77
-
78
-
79
-
80
-
81
-
82
-
83
-
84
-
85
-
86
-
87
-
88
-
89
-
90
-
91
-
92
-
93
-
94
-
95
-
96
-
97
-
98
-
99
-
100
-
101
-
102
-
103
-
104
-
105
-
106
-
107
-
108
-
109
-
110
-
111
-
112
-
113
-
114
-
115
-
116
-
117
-
118
-
119
-
120
-
121
-
122
-
123
-
124
-
125
-
126
-
127
-
128
-
129
-
130
-
131
-
132
-
133
-
134
-
135
-
136
-
137
-
138
-
139
-
140
-
141
-
142
-
143
-
144
-
145
-
146
-
147
-
148
-
149
-
150
-
151
-
152
-
153
-
154
-
155
-
156
-
157
-
158
-
159
-
160
-
161
-
162
-
163
-
164
-
165
-
166
-
167
-
168
-
169
-
170
-
171
-
172
-
173
-
174
-
175
-
176
-
177
-
178
-
179
-
180
-
181
-
182
-
183
-
184
-
185
-
186
-
187
-
188
-
189
-
190
-
191
-
192
-
193
-
194
-
195
-
196
-
197
-
198
-
199
-
200
-
201
-
202
-
203
-
204
-
205
-
206
-
207
-
208
-
209
-
210
-
211
-
212
-
213
-
214
-
215
-
216
-
217
-
218
-
219
-
220
-
221
-
222
-
223
-
224
 |
 |

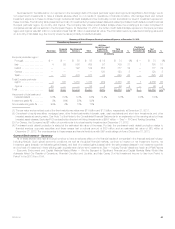
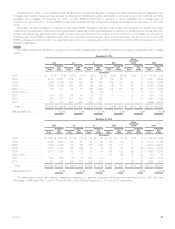
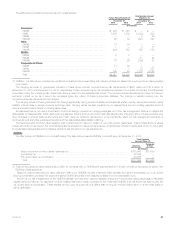
(1) Commercial mortgage loans by property type amounts for the prior period have been reclassified to conform to the current period method of
classifying loans collateralized by mixed-used properties according to the predominant property type.
Mortgage Loan Credit Quality — Monitoring Process. We monitor our mortgage loan investments on an ongoing basis, including reviewing loans
that are current, past due, restructured and under foreclosure. See Note 8 of the Notes to the Consolidated Financial Statements for tables that present
mortgage loans by credit quality indicator, past due and nonaccrual mortgage loans, impaired mortgage loans, as well as loans modified in a troubled
debt restructuring. See “— Real Estate and Real Estate Joint Ventures” for real estate acquired through foreclosure.
Commercial and Agricultural Mortgage Loans. We review our commercial mortgage loans on an ongoing basis. These reviews may include an
analysis of the property financial statements and rent roll, lease rollover analysis, property inspections, market analysis, estimated valuations of the
underlying collateral, loan-to-value ratios, debt service coverage ratios, and tenant creditworthiness. The monitoring process focuses on higher risk
loans, which include those that are classified as restructured, delinquent or in foreclosure, as well as loans with higher loan-to-value ratios and lower
debt service coverage ratios. The monitoring process for agricultural mortgage loans is generally similar, with a focus on higher risk loans, such as loans
with higher loan-to-value ratios, including reviews on a geographic and property type basis.
Loan-to-value ratios and debt service coverage ratios are common measures in the assessment of the quality of commercial mortgage loans. Loan-
to-value ratios are a common measure in the assessment of the quality of agricultural mortgage loans. Loan-to-value ratios compare the amount of the
loan to the estimated fair value of the underlying collateral. A loan-to-value ratio greater than 100% indicates that the loan amount is greater than the
collateral value. A loan-to-value ratio of less than 100% indicates an excess of collateral value over the loan amount. Generally, the higher the loan-to-
value ratio, the higher the risk of experiencing a credit loss. The debt service coverage ratio compares a property’s net operating income to amounts
needed to service the principal and interest due under the loan. Generally, the lower the debt service coverage ratio, the higher the risk of experiencing
a credit loss. For our commercial mortgage loans, our average loan-to-value ratio was 55% and 57% at December 31, 2013 and 2012, respectively,
and our average debt service coverage ratio was 2.4x and 2.2x at December 31, 2013 and 2012, respectively. The commercial mortgage loan debt
service coverage ratio and loan-to-value ratio, as well as the values utilized in calculating these ratios, are updated annually, on a rolling basis, with a
portion of the commercial mortgage loan portfolio updated each quarter. For our agricultural mortgage loans, our average loan-to-value ratio was 45%
and 46% at December 31, 2013 and 2012, respectively. The values utilized in calculating the agricultural mortgage loan loan-to-value ratio are
developed in connection with the ongoing review of the agricultural loan portfolio and are routinely updated.
Mortgage Loan Valuation Allowances. Our valuation allowances are established both on a loan specific basis for those loans considered impaired
where a property specific or market specific risk has been identified that could likely result in a future loss, as well as for pools of loans with similar risk
characteristics where a property specific or market specific risk has not been identified, but for which we expect to incur a loss. Accordingly, a valuation
allowance is provided to absorb these estimated probable credit losses.
The determination of the amount of valuation allowances is based upon our periodic evaluation and assessment of known and inherent risks
associated with our loan portfolios. Such evaluations and assessments are based upon several factors, including our experience for loan losses,
defaults and loss severity, and loss expectations for loans with similar risk characteristics. These evaluations and assessments are revised as conditions
change and new information becomes available, which can cause the valuation allowances to increase or decrease over time as such evaluations are
revised. Negative credit migration, including an actual or expected increase in the level of problem loans, will result in an increase in the valuation
allowance. Positive credit migration, including an actual or expected decrease in the level of problem loans, will result in a decrease in the valuation
allowance.
See Notes 1, 8 and 10 of the Notes to the Consolidated Financial Statements for information about how valuation allowances are established and
monitored, activity in and balances of the valuation allowance, and the estimated fair value of impaired mortgage loans and related impairments included
within net investment gains (losses) as of and for the years ended December 31, 2013, 2012 and 2011.
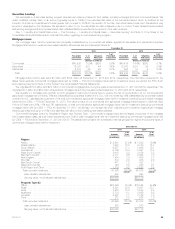
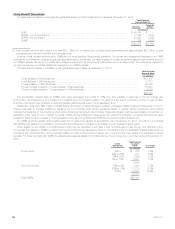
Real Estate and Real Estate Joint Ventures
We diversify our real estate investments by both geographic region and property type to reduce risk of concentration. Of our real estate investments,
86% were located in the United States, with the remaining 14% located outside the United States, at December 31, 2013. The three locations with the
largest real estate investments were California, Japan and Florida at 20%, 12%, and 11%, respectively, at December 31, 2013.
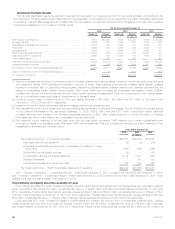
Real estate investments by type consisted of the following at:
December 31,
2013 2012
Carrying
Value %of
Total Carrying
Value %of
Total
(In millions) (In millions)
Traditional .......................................................... $ 9,312 86.9% $8,488 85.6%
Real estate joint ventures and funds ...................................... 769 7.2 941 9.5
Subtotal ........................................................... 10,081 94.1 9,429 95.1
Foreclosed (commercial, agricultural and residential) .......................... 445 4.2 488 4.9
Real estate held-for-investment ......................................... 10,526 98.3 9,917 100.0
Real estate held-for-sale ............................................... 186 1.7 1 —
Total real estate and real estate joint ventures .............................. $10,712 100.0% $9,918 100.0%
We classify within traditional real estate our investment in income-producing real estate, which is comprised primarily of wholly-owned real estate
and, to a much lesser extent, joint ventures with interests in single property income-producing real estate. The estimated fair value of the traditional and
held-for-sale real estate investment portfolios was $12.5 billion and $10.7 billion at December 31, 2013 and 2012, respectively. We classify within real
estate joint ventures and funds, our investments in joint ventures with interests in multi-property projects with varying strategies ranging from the
development of properties to the operation of income-producing properties, as well as our investments in real estate private equity funds. From time to
time, we transfer investments from these joint ventures to traditional real estate, if we retain an interest in the joint venture after a completed property
commences operations and we intend to retain an interest in the property.
50 MetLife, Inc.