MetLife 2013 Annual Report Download - page 74
Download and view the complete annual report
Please find page 74 of the 2013 MetLife annual report below. You can navigate through the pages in the report by either clicking on the pages listed below, or by using the keyword search tool below to find specific information within the annual report.-
 1
1 -
2
-
3
-
4
-
5
-
6
-
7
-
8
-
9
-
10
-
11
-
12
-
13
-
14
-
15
-
16
-
17
-
18
-
19
-
20
-
21
-
22
-
23
-
24
-
25
-
26
-
27
-
28
-
29
-
30
-
31
-
32
-
33
-
34
-
35
-
36
-
37
-
38
-
39
-
40
-
41
-
42
-
43
-
44
-
45
-
46
-
47
-
48
-
49
-
50
-
51
-
52
-
53
-
54
-
55
-
56
-
57
-
58
-
59
-
60
-
61
-
62
-
63
-
 64
64 -
 65
65 -
 66
66 -
 67
67 -
 68
68 -
 69
69 -
 70
70 -
 71
71 -
 72
72 -
 73
73 -
 74
74 -
 75
75 -
 76
76 -
 77
77 -
 78
78 -
 79
79 -
 80
80 -
 81
81 -
 82
82 -
 83
83 -
 84
84 -
85
-
86
-
87
-
88
-
89
-
90
-
91
-
92
-
93
-
94
-
95
-
96
-
97
-
98
-
99
-
100
-
101
-
102
-
103
-
104
-
105
-
106
-
107
-
108
-
109
-
110
-
111
-
112
-
113
-
114
-
115
-
116
-
117
-
118
-
119
-
120
-
121
-
122
-
123
-
124
-
125
-
126
-
127
-
128
-
129
-
130
-
131
-
132
-
133
-
134
-
135
-
136
-
137
-
138
-
139
-
140
-
141
-
142
-
143
-
144
-
145
-
146
-
147
-
148
-
149
-
150
-
151
-
152
-
153
-
154
-
155
-
156
-
157
-
158
-
159
-
160
-
161
-
162
-
163
-
164
-
165
-
166
-
167
-
168
-
169
-
170
-
171
-
172
-
173
-
174
-
175
-
176
-
177
-
178
-
179
-
180
-
181
-
182
-
183
-
184
-
185
-
186
-
187
-
188
-
189
-
190
-
191
-
192
-
193
-
194
-
195
-
196
-
197
-
198
-
199
-
200
-
201
-
202
-
203
-
204
-
205
-
206
-
207
-
208
-
209
-
210
-
211
-
212
-
213
-
214
-
215
-
216
-
217
-
218
-
219
-
220
-
221
-
222
-
223
-
224
 |
 |

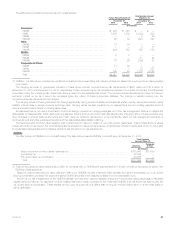
securities lending program, we were liable for cash collateral under our control of $28.3 billion and $27.7 billion at December 31, 2013 and 2012,
respectively. Of these amounts, $6.0 billion and $5.0 billion at December 31, 2013 and 2012, respectively, were on open, meaning that the related
loaned security could be returned to us on the next business day requiring the immediate return of cash collateral we hold. The estimated fair value of
the securities on loan related to the cash collateral on open at December 31, 2013 was $5.9 billion, of which $5.6 billion were U.S. Treasury and
agency securities which, if put to us, could be immediately sold to satisfy the cash requirements to immediately return the cash collateral. See “—
Investments — Securities Lending” for further information.
Litigation
Putative or certified class action litigation and other litigation, and claims and assessments against us, in addition to those discussed elsewhere
herein and those otherwise provided for in the consolidated financial statements, have arisen in the course of our business, including, but not limited
to, in connection with our activities as an insurer, employer, investor, investment advisor, taxpayer and, formerly, a mortgage lending bank. Further,
state insurance regulatory authorities and other federal and state authorities regularly make inquiries and conduct investigations concerning our
compliance with applicable insurance and other laws and regulations. See Note 21 of the Notes to the Consolidated Financial Statements.
We establish liabilities for litigation and regulatory loss contingencies when it is probable that a loss has been incurred and the amount of the loss
can be reasonably estimated. For material matters where a loss is believed to be reasonably possible but not probable, no accrual is made but we
disclose the nature of the contingency and an aggregate estimate of the reasonably possible range of loss in excess of amounts accrued, when such
an estimate can be made. It is not possible to predict or determine the ultimate outcome of all pending investigations and legal proceedings. In some
of the matters referred to herein, very large and/or indeterminate amounts, including punitive and treble damages, are sought. Although in light of
these considerations, it is possible that an adverse outcome in certain cases could have a material adverse effect upon our financial position, based
on information currently known by us, in our opinion, the outcome of such pending investigations and legal proceedings are not likely to have such an
effect. However, given the large and/or indeterminate amounts sought in certain of these matters and the inherent unpredictability of litigation, itis
possible that an adverse outcome in certain matters could, from time to time, have a material adverse effect on our consolidated net income or cash
flows in particular quarterly or annual periods.
Acquisitions
Cash outflows for acquisitions during the years ended December 31, 2013, 2012 and 2011 were $1.9 billion, $49 million and $233 million,
respectively. See Note 3 of the Notes to the Consolidated Financial Statements for information regarding acquisitions.
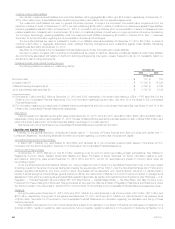
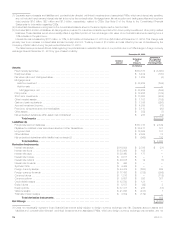
Contractual Obligations
The following table summarizes our major contractual obligations at December 31, 2013:
Total One Year
or Less
More than
One Year to
Three Years
More than
Three Years to
Five Years More than
Five Years
(In millions)
Insurance liabilities ................................................... $347,807 $ 17,779 $13,341 $15,285 $301,402
Policyholder account balances ......................................... 294,016 35,547 41,475 27,889 189,105
Payables for collateral under securities loaned and other transactions ........... 30,411 30,411 — — —
Debt .............................................................. 42,237 2,724 4,629 3,987 30,897
Investment commitments .............................................. 8,651 8,458 193 — —
Operating leases .................................................... 1,765 264 402 300 799
Other ............................................................. 18,040 17,576 — — 464
Total ............................................................ $742,927 $112,759 $60,040 $47,461 $522,667
Insurance Liabilities
Insurance liabilities include future policy benefits, other policy-related balances, policyholder dividends payable and the policyholder dividend
obligation, which are all reported on the consolidated balance sheet and are more fully described in Notes 1 and 4 of the Notes to the Consolidated
Financial Statements. The amounts presented reflect future estimated cash payments and (i) are based on mortality, morbidity, lapse and other
assumptions comparable with our experience and expectations of future payment patterns; and (ii) consider future premium receipts on current
policies in-force. All estimated cash payments presented are undiscounted as to interest, net of estimated future premiums on in-force policies and
gross of any reinsurance recoverable. Payment of amounts related to policyholder dividends left on deposit are projected based on assumptions of
policyholder withdrawal activity. Because the exact timing and amount of the ultimate policyholder dividend obligation is subject to significant
uncertainty and the amount of the policyholder dividend obligation is based upon a long-term projection of the performance of the closed block, we
have reflected the obligation at the amount of the liability, if any, presented in the consolidated balance sheet in the more than five years category.
Additionally, the more than five years category includes estimated payments due for periods extending for more than 100 years.
The sum of the estimated cash flows shown for all years of $347.8 billion exceeds the liability amounts of $205.6 billion included on the
consolidated balance sheet principally due to (i) the time value of money, which accounts for a substantial portion of the difference; and (ii) differences
in assumptions, most significantly mortality, between the date the liabilities were initially established and the current date; and are partially offset by
liabilities related to accounting conventions, or which are not contractually due, which are excluded.
Actual cash payments may differ significantly from the liabilities as presented in the consolidated balance sheets and the estimated cash
payments as presented due to differences between actual experience and the assumptions used in the establishment of these liabilities and the
estimation of these cash payments.
For the majority of our insurance operations, estimated contractual obligations for future policy benefits and PABs, as presented, are derived from
the annual asset adequacy analysis used to develop actuarial opinions of statutory reserve adequacy for state regulatory purposes. These cash flows
are materially representative of the cash flows under GAAP. See “— Policyholder Account Balances.”
Policyholder Account Balances
See Notes 1 and 4 of the Notes to the Consolidated Financial Statements for a description of the components of PABs. See “— Insurance
Liabilities” regarding the source and uncertainties associated with the estimation of the contractual obligations related to future policy benefits and PABs.
66 MetLife, Inc.