MetLife 2013 Annual Report Download - page 202
Download and view the complete annual report
Please find page 202 of the 2013 MetLife annual report below. You can navigate through the pages in the report by either clicking on the pages listed below, or by using the keyword search tool below to find specific information within the annual report.-
 1
1 -
2
-
3
-
4
-
5
-
6
-
7
-
8
-
9
-
10
-
11
-
12
-
13
-
14
-
15
-
16
-
17
-
18
-
19
-
20
-
21
-
22
-
23
-
24
-
25
-
26
-
27
-
28
-
29
-
30
-
31
-
32
-
33
-
34
-
35
-
36
-
37
-
38
-
39
-
40
-
41
-
42
-
43
-
44
-
45
-
46
-
47
-
48
-
49
-
50
-
51
-
52
-
53
-
54
-
55
-
56
-
57
-
58
-
59
-
60
-
61
-
62
-
63
-
64
-
65
-
66
-
67
-
68
-
69
-
70
-
71
-
72
-
73
-
74
-
75
-
76
-
77
-
78
-
79
-
80
-
81
-
82
-
83
-
84
-
85
-
86
-
87
-
88
-
89
-
90
-
91
-
92
-
93
-
94
-
95
-
96
-
97
-
98
-
99
-
100
-
101
-
102
-
103
-
104
-
105
-
106
-
107
-
108
-
109
-
110
-
111
-
112
-
113
-
114
-
115
-
116
-
117
-
118
-
119
-
120
-
121
-
122
-
123
-
124
-
125
-
126
-
127
-
128
-
129
-
130
-
131
-
132
-
133
-
134
-
135
-
136
-
137
-
138
-
139
-
140
-
141
-
142
-
143
-
144
-
145
-
146
-
147
-
148
-
149
-
150
-
151
-
152
-
153
-
154
-
155
-
156
-
157
-
158
-
159
-
160
-
161
-
162
-
163
-
164
-
165
-
166
-
167
-
168
-
169
-
170
-
171
-
172
-
173
-
174
-
175
-
176
-
177
-
178
-
179
-
180
-
181
-
182
-
183
-
184
-
185
-
186
-
187
-
188
-
189
-
190
-
191
-
 192
192 -
 193
193 -
 194
194 -
 195
195 -
 196
196 -
 197
197 -
 198
198 -
 199
199 -
 200
200 -
 201
201 -
 202
202 -
 203
203 -
 204
204 -
 205
205 -
 206
206 -
 207
207 -
 208
208 -
 209
209 -
 210
210 -
 211
211 -
 212
212 -
213
-
214
-
215
-
216
-
217
-
218
-
219
-
220
-
221
-
222
-
223
-
224
 |
 |

MetLife, Inc.
Notes to the Consolidated Financial Statements — (Continued)
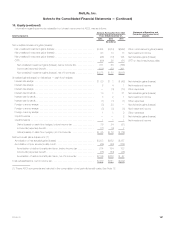
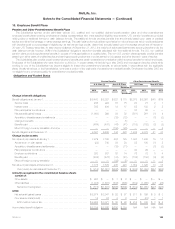
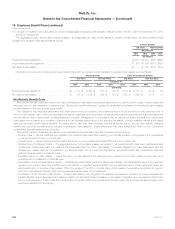
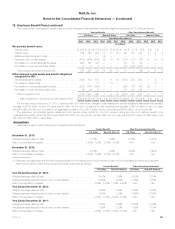
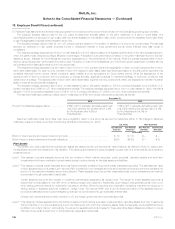
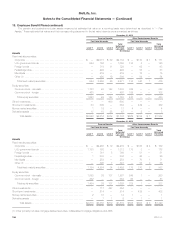
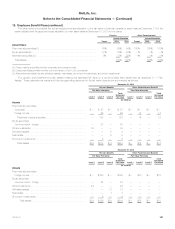
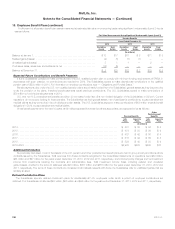
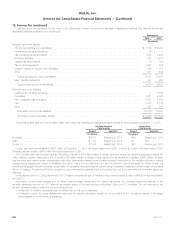
18. Employee Benefit Plans (continued)
The pension and postretirement plan assets measured at estimated fair value on a recurring basis were determined as described in “— Plan
Assets.” These estimated fair values and their corresponding placement in the fair value hierarchy are summarized as follows:
December 31, 2013
Pension Benefits Other Postretirement Benefits
Fair Value Hierarchy Fair Value Hierarchy
Level 1 Level 2 Level 3
Total
Estimated
Fair Value Level 1 Level 2 Level 3
Total
Estimated
Fair Value
(In millions)
Assets
Fixed maturity securities:
Corporate .............................................. $ — $2,073 $ 59 $2,132 $ — $170 $ 1 $ 171
U.S. government bonds ................................... 924 166 — 1,090 135 5 — 140
Foreign bonds ........................................... — 718 11 729 — 63 — 63
Federal agencies ......................................... — 292 — 292 — 33 — 33
Municipals .............................................. — 219 — 219 — 15 — 15
Other (1) ............................................... — 490 19 509 — 54 — 54
Total fixed maturity securities .............................. 924 3,958 89 4,971 135 340 1 476
Equity securities:
Common stock - domestic ................................. 1,133 22 148 1,303 328 — — 328
Common stock - foreign ................................... 460 — — 460 102 — — 102
Total equity securities ................................... 1,593 22 148 1,763 430 — — 430
Other investments .......................................... — — 600 600 — — — —
Short-term investments ...................................... 53 309 — 362 — 439 — 439
Money market securities ..................................... 1 12 — 13 4 — — 4
Derivative assets ........................................... 17 15 35 67 — 3 — 3
Total assets ......................................... $2,588 $4,316 $872 $7,776 $569 $782 $ 1 $1,352
December 31, 2012
Pension Benefits Other Postretirement Benefits
Fair Value Hierarchy Fair Value Hierarchy
Level 1 Level 2 Level 3
Total
Estimated
Fair Value Level 1 Level 2 Level 3
Total
Estimated
Fair Value
(In millions)
Assets
Fixed maturity securities:
Corporate .............................................. $ — $2,260 $ 19 $2,279 $ — $165 $ 4 $ 169
U.S. government bonds ................................... 1,153 160 — 1,313 175 3 — 178
Foreign bonds ........................................... — 761 8 769 — 51 — 51
Federal agencies ......................................... 1 335 — 336 — 26 — 26
Municipals .............................................. — 258 — 258 — 70 1 71
Other (1) ............................................... — 490 7 497 — 55 3 58
Total fixed maturity securities .............................. 1,154 4,264 34 5,452 175 370 8 553
Equity securities:
Common stock - domestic ................................. 1,092 38 137 1,267 249 1 — 250
Common stock - foreign ................................... 362 — — 362 83 — — 83
Total equity securities ................................... 1,454 38 137 1,629 332 1 — 333
Other investments .......................................... — 117 447 564 — — — —
Short-term investments ...................................... — 214 — 214 — 432 — 432
Money market securities ..................................... 2 10 — 12 1 — — 1
Derivative assets ........................................... — 7 1 8 — 1 — 1
Total assets ......................................... $2,610 $4,650 $619 $7,879 $508 $804 $ 8 $1,320
(1) Other primarily includes mortgage-backed securities, collateralized mortgage obligations and ABS.
194 MetLife, Inc.