MetLife 2013 Annual Report Download - page 16
Download and view the complete annual report
Please find page 16 of the 2013 MetLife annual report below. You can navigate through the pages in the report by either clicking on the pages listed below, or by using the keyword search tool below to find specific information within the annual report.-
 1
1 -
2
-
3
-
4
-
5
-
 6
6 -
 7
7 -
 8
8 -
 9
9 -
 10
10 -
 11
11 -
 12
12 -
 13
13 -
 14
14 -
 15
15 -
 16
16 -
 17
17 -
 18
18 -
 19
19 -
 20
20 -
 21
21 -
 22
22 -
 23
23 -
 24
24 -
 25
25 -
 26
26 -
27
-
28
-
29
-
30
-
31
-
32
-
33
-
34
-
35
-
36
-
37
-
38
-
39
-
40
-
41
-
42
-
43
-
44
-
45
-
46
-
47
-
48
-
49
-
50
-
51
-
52
-
53
-
54
-
55
-
56
-
57
-
58
-
59
-
60
-
61
-
62
-
63
-
64
-
65
-
66
-
67
-
68
-
69
-
70
-
71
-
72
-
73
-
74
-
75
-
76
-
77
-
78
-
79
-
80
-
81
-
82
-
83
-
84
-
85
-
86
-
87
-
88
-
89
-
90
-
91
-
92
-
93
-
94
-
95
-
96
-
97
-
98
-
99
-
100
-
101
-
102
-
103
-
104
-
105
-
106
-
107
-
108
-
109
-
110
-
111
-
112
-
113
-
114
-
115
-
116
-
117
-
118
-
119
-
120
-
121
-
122
-
123
-
124
-
125
-
126
-
127
-
128
-
129
-
130
-
131
-
132
-
133
-
134
-
135
-
136
-
137
-
138
-
139
-
140
-
141
-
142
-
143
-
144
-
145
-
146
-
147
-
148
-
149
-
150
-
151
-
152
-
153
-
154
-
155
-
156
-
157
-
158
-
159
-
160
-
161
-
162
-
163
-
164
-
165
-
166
-
167
-
168
-
169
-
170
-
171
-
172
-
173
-
174
-
175
-
176
-
177
-
178
-
179
-
180
-
181
-
182
-
183
-
184
-
185
-
186
-
187
-
188
-
189
-
190
-
191
-
192
-
193
-
194
-
195
-
196
-
197
-
198
-
199
-
200
-
201
-
202
-
203
-
204
-
205
-
206
-
207
-
208
-
209
-
210
-
211
-
212
-
213
-
214
-
215
-
216
-
217
-
218
-
219
-
220
-
221
-
222
-
223
-
224
 |
 |

On November 1, 2010, MetLife, Inc. completed the acquisition of American Life Insurance Company (“American Life”) from AM Holdings LLC
(formerly known as ALICO Holdings LLC), a subsidiary of American International Group, Inc. (“AIG”), and Delaware American Life Insurance Company
(“DelAm”) from AIG (American Life, together with DelAm, collectively, “ALICO”) (the “ALICO Acquisition”). The assets, liabilities and operating results
relating to the ALICO Acquisition are included in the Latin America, Asia and EMEA segments. See Note 3 of the Notes to the Consolidated Financial
Statements.
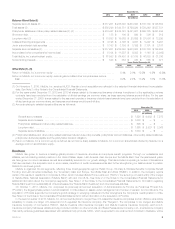
Certain international subsidiaries have a fiscal year-end of November 30. Accordingly, the Company’s consolidated financial statements reflect the
assets and liabilities of such subsidiaries as of November 30, 2013 and 2012 and the operating results of such subsidiaries for the years ended
November 30, 2013, 2012 and 2011.
We continue to experience an increase in sales in several of our businesses; however, global economic conditions continue to negatively impact the
demand for certain of our products. Also, as a result of our continued focus on pricing discipline and risk management in this challenging economic
environment, we adjusted certain product features of our variable annuity products which resulted in a decrease in sales of such products. An increase
in average value of our separate accounts from both favorable equity market performance and positive net flows produced higher asset-based fee
revenue. The sustained low interest rate environment reduced investment yields, but also reduced crediting rates. In addition, changes in long-term
interest rates and foreign currency exchange rates resulted in an increase in derivative losses. Finally, the prior period included a goodwill impairment
charge.
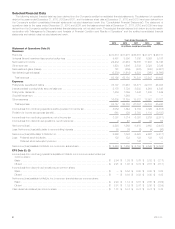
Years Ended December 31,
2013 2012 2011
(In millions)
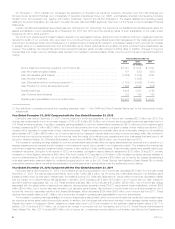
Income (loss) from continuing operations, net of income tax ............................. $3,391 $ 1,314 $ 6,391
Less: Net investment gains (losses) ................................................ 161 (352) (867)
Less: Net derivative gains (losses) ................................................. (3,239) (1,919) 4,824
Less: Goodwill impairment ....................................................... — (1,868) —
Less: Other adjustments to continuing operations (1) .................................. (1,638) (2,550) (1,451)
Less: Provision for income tax (expense) benefit ...................................... 1,698 2,195 (914)
Operating earnings ............................................................. 6,409 5,808 4,799
Less: Preferred stock dividends ................................................... 122 122 122
Operating earnings available to common shareholders ................................. $6,287 $ 5,686 $ 4,677
(1) See definitions of operating revenues and operating expenses under “— Non-GAAP and Other Financial Disclosures” for the components of such
adjustments.
Year Ended December 31, 2013 Compared with the Year Ended December 31, 2012
During the year ended December 31, 2013, income (loss) from continuing operations, net of income tax, increased $2.1 billion over 2012. The
change was predominantly due to a non-cash charge in 2012 of $1.9 billion ($1.6 billion, net of income tax) for goodwill impairment associated with our
U.S. Retail annuities business. In addition, operating earnings available to common shareholders increased by $601 million and net investment gains
(losses) increased by $513 million ($333 million, net of income tax) primarily due to an increase in net gains on sales of fixed maturity securities in 2013
coupled with a decrease in impairments of fixed maturity securities. These increases were partially offset by an unfavorable change in net derivatives
gains (losses) of $1.3 billion ($858 million, net of income tax) driven by changes in interest rates and foreign currency exchange rates. Also includedin
income (loss) from continuing operations, net of income tax, were the results of the discontinued operations and other businesses that have been or will
be sold or exited by MetLife, Inc. (“Divested Businesses”), which improved $459 million ($294 million, net of income tax) over 2012.
The increase in operating earnings available to common shareholders was primarily driven by higher asset-based fee revenues due to growth in our
average separate account assets and an increase in net investment income due to growth in our investment portfolio. The sustained low interest rate
environment negatively impacted investment yields; however, it also resulted in lower crediting rates. These favorable results were partially offset by an
increase in expenses. During the fourth quarter of 2013, we increased our litigation reserve related to asbestos by $101 million. During 2013, we also
increased our other litigation reserves by $46 million. The fourth quarter 2013 acquisition of ProVida in Chile increased operating earnings available to
common shareholders by $48 million, net of income tax. In addition, results for 2012 included a $52 million, net of income tax, charge representing a
multi-state examination payment related to unclaimed property and our use of the U.S. Social Security Administration’s Death Master File to identify
potential life insurance claims, as well as the acceleration of benefit payments to policyholders under the settlements of such claims.
Year Ended December 31, 2012 Compared with the Year Ended December 31, 2011
During the year ended December 31, 2012, income (loss) from continuing operations, net of income tax, decreased $5.1 billion from the year ended
December 31, 2011. The change was predominantly due to a $6.7 billion ($4.4 billion, net of income tax), unfavorable change in net derivative gains
(losses) primarily driven by changes in interest rates, the weakening of the U.S. dollar and Japanese yen, equity market movements, decreased volatility
and the impact of a nonperformance risk adjustment. In addition, 2012 includes a $1.9 billion ($1.6 billion, net of income tax) non-cash charge for
goodwill impairment associated with our U.S. Retail annuities business. Also, 2012 includes a $1.2 billion ($752 million, net of income tax) charge
associated with the global review of assumptions related to deferred policy acquisition costs (“DAC”), reserves and certain intangibles, of which $526
million ($342 million, net of income tax) was reflected in net derivative gains (losses). Also included in income (loss) from continuing operations, net of
income tax, were the unfavorable results of the Divested Businesses, which decreased $724 million ($476 million, net of income tax) from 2011. These
declines were partially offset by a $1.0 billion, net of income tax, increase in operating earnings available to common shareholders.
The increase in operating earnings available to common shareholders was primarily driven by improved investment results and higher asset-based
fee revenue as strong sales levels drove portfolio growth. In addition, the low interest rate environment resulted in lower average interest credited rates.
Despite the impact of Superstorm Sandy, catastrophe losses were lower in 2012 as compared to the significant weather-related claims in 2011. In
addition, 2011 included a $117 million, net of income tax, charge in connection with the Company’s use of the U.S. Social Security Administration’s
Death Master File. Also, 2011 included $40 million, net of income tax, of expenses incurred related to a liquidation plan filed by the Department of
8MetLife, Inc.