MetLife 2013 Annual Report Download - page 165
Download and view the complete annual report
Please find page 165 of the 2013 MetLife annual report below. You can navigate through the pages in the report by either clicking on the pages listed below, or by using the keyword search tool below to find specific information within the annual report.-
 1
1 -
2
-
3
-
4
-
5
-
6
-
7
-
8
-
9
-
10
-
11
-
12
-
13
-
14
-
15
-
16
-
17
-
18
-
19
-
20
-
21
-
22
-
23
-
24
-
25
-
26
-
27
-
28
-
29
-
30
-
31
-
32
-
33
-
34
-
35
-
36
-
37
-
38
-
39
-
40
-
41
-
42
-
43
-
44
-
45
-
46
-
47
-
48
-
49
-
50
-
51
-
52
-
53
-
54
-
55
-
56
-
57
-
58
-
59
-
60
-
61
-
62
-
63
-
64
-
65
-
66
-
67
-
68
-
69
-
70
-
71
-
72
-
73
-
74
-
75
-
76
-
77
-
78
-
79
-
80
-
81
-
82
-
83
-
84
-
85
-
86
-
87
-
88
-
89
-
90
-
91
-
92
-
93
-
94
-
95
-
96
-
97
-
98
-
99
-
100
-
101
-
102
-
103
-
104
-
105
-
106
-
107
-
108
-
109
-
110
-
111
-
112
-
113
-
114
-
115
-
116
-
117
-
118
-
119
-
120
-
121
-
122
-
123
-
124
-
125
-
126
-
127
-
128
-
129
-
130
-
131
-
132
-
133
-
134
-
135
-
136
-
137
-
138
-
139
-
140
-
141
-
142
-
143
-
144
-
145
-
146
-
147
-
148
-
149
-
150
-
151
-
152
-
153
-
154
-
 155
155 -
 156
156 -
 157
157 -
 158
158 -
 159
159 -
 160
160 -
 161
161 -
 162
162 -
 163
163 -
 164
164 -
 165
165 -
 166
166 -
 167
167 -
 168
168 -
 169
169 -
 170
170 -
 171
171 -
 172
172 -
 173
173 -
 174
174 -
 175
175 -
176
-
177
-
178
-
179
-
180
-
181
-
182
-
183
-
184
-
185
-
186
-
187
-
188
-
189
-
190
-
191
-
192
-
193
-
194
-
195
-
196
-
197
-
198
-
199
-
200
-
201
-
202
-
203
-
204
-
205
-
206
-
207
-
208
-
209
-
210
-
211
-
212
-
213
-
214
-
215
-
216
-
217
-
218
-
219
-
220
-
221
-
222
-
223
-
224
 |
 |

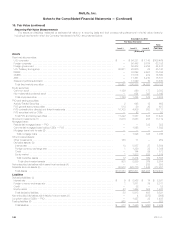
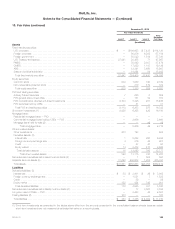
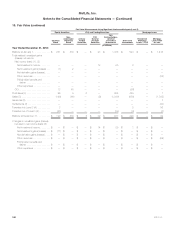
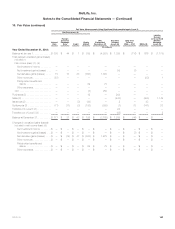
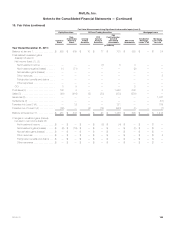
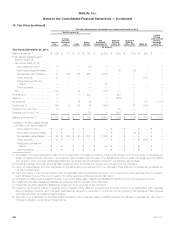
MetLife, Inc.
Notes to the Consolidated Financial Statements — (Continued)
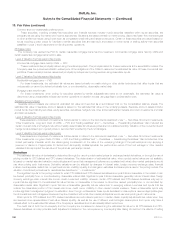
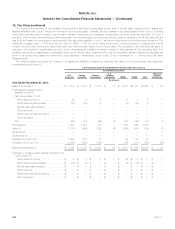
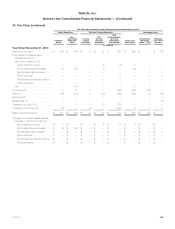
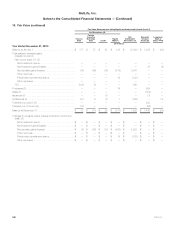
10. Fair Value (continued)
(1) The weighted average for fixed maturity securities is determined based on the estimated fair value of the securities.
(2) The impact of a decrease in input would have the opposite impact on the estimated fair value. For embedded derivatives, changes are based on
liability positions.
(3) Significant increases (decreases) in expected default rates in isolation would result in substantially lower (higher) valuations.
(4) Range and weighted average are presented in basis points.
(5) Range and weighted average are presented in accordance with the market convention for fixed maturity securities of dollars per hundred dollars of
par.
(6) Changes in the assumptions used for the probability of default is accompanied by a directionally similar change in the assumption used for the loss
severity and a directionally opposite change in the assumptions used for prepayment rates.
(7) Ranges represent the rates across different yield curves and are presented in basis points. The swap yield curve is utilized among different types of
derivatives to project cash flows, as well as to discount future cash flows to present value. Since this valuation methodology uses a range of inputs
across a yield curve to value the derivative, presenting a range is more representative of the unobservable input used in the valuation.
(8) Ranges represent the different correlation factors utilized as components within the valuation methodology. Presenting a range of correlation factors
is more representative of the unobservable input used in the valuation. Increases (decreases) in correlation in isolation will increase (decrease) the
significance of the change in valuations.
(9) Represents the risk quoted in basis points of a credit default event on the underlying instrument. The range being provided is a single quoted
spread in the valuation model. Credit derivatives with significant unobservable inputs are primarily comprised of written credit default swaps.
(10) At both December 31, 2013 and 2012, independent non-binding broker quotations were used in the determination of less than 1% of the total net
derivative estimated fair value.
(11) Ranges represent the underlying equity volatility quoted in percentage points. Since this valuation methodology uses a range of inputs across
multiple volatility surfaces to value the derivative, presenting a range is more representative of the unobservable input used in the valuation.
(12) Changes are based on long U.S. dollar net asset positions and will be inversely impacted for short U.S. dollar net asset positions.
(13) Mortality rates vary by age and by demographic characteristics such as gender. Mortality rate assumptions are based on company experience. A
mortality improvement assumption is also applied. For any given contract, mortality rates vary throughout the period over which cash flows are
projected for purposes of valuing the embedded derivative.
(14) Base lapse rates are adjusted at the contract level based on a comparison of the actuarially calculated guaranteed values and the current
policyholder account value, as well as other factors, such as the applicability of any surrender charges. A dynamic lapse function reduces the base
lapse rate when the guaranteed amount is greater than the account value as in the money contracts are less likely to lapse. Lapse rates are also
generally assumed to be lower in periods when a surrender charge applies. For any given contract, lapse rates vary throughout the period over
which cash flows are projected for purposes of valuing the embedded derivative.
(15) The utilization rate assumption estimates the percentage of contract holders with a GMIB or lifetime withdrawal benefit who will elect to utilize the
benefit upon becoming eligible. The rates may vary by the type of guarantee, the amount by which the guaranteed amount is greater than the
account value, the contract’s withdrawal history and by the age of the policyholder. For any given contract, utilization rates vary throughout the
period over which cash flows are projected for purposes of valuing the embedded derivative.
(16) The withdrawal rate represents the percentage of account balance that any given policyholder will elect to withdraw from the contract each year.
The withdrawal rate assumption varies by age and duration of the contract, and also by other factors such as benefit type. For any given contract,
withdrawal rates vary throughout the period over which cash flows are projected for purposes of valuing the embedded derivative. For GMWBs, any
increase (decrease) in withdrawal rates results in an increase (decrease) in the estimated fair value of the guarantees. For GMABs and GMIBs, any
increase (decrease) in withdrawal rates results in a decrease (increase) in the estimated fair value.
(17) Long-term equity volatilities represent equity volatility beyond the period for which observable equity volatilities are available. For any given contract,
long-term equity volatility rates vary throughout the period over which cash flows are projected for purposes of valuing the embedded derivative.
(18) Nonperformance risk spread varies by duration and by currency. For any given contract, multiple nonperformance risk spreads will apply,
depending on the duration of the cash flow being discounted for purposes of valuing the embedded derivative.
MetLife, Inc. 157