MetLife 2013 Annual Report Download - page 133
Download and view the complete annual report
Please find page 133 of the 2013 MetLife annual report below. You can navigate through the pages in the report by either clicking on the pages listed below, or by using the keyword search tool below to find specific information within the annual report.-
 1
1 -
2
-
3
-
4
-
5
-
6
-
7
-
8
-
9
-
10
-
11
-
12
-
13
-
14
-
15
-
16
-
17
-
18
-
19
-
20
-
21
-
22
-
23
-
24
-
25
-
26
-
27
-
28
-
29
-
30
-
31
-
32
-
33
-
34
-
35
-
36
-
37
-
38
-
39
-
40
-
41
-
42
-
43
-
44
-
45
-
46
-
47
-
48
-
49
-
50
-
51
-
52
-
53
-
54
-
55
-
56
-
57
-
58
-
59
-
60
-
61
-
62
-
63
-
64
-
65
-
66
-
67
-
68
-
69
-
70
-
71
-
72
-
73
-
74
-
75
-
76
-
77
-
78
-
79
-
80
-
81
-
82
-
83
-
84
-
85
-
86
-
87
-
88
-
89
-
90
-
91
-
92
-
93
-
94
-
95
-
96
-
97
-
98
-
99
-
100
-
101
-
102
-
103
-
104
-
105
-
106
-
107
-
108
-
109
-
110
-
111
-
112
-
113
-
114
-
115
-
116
-
117
-
118
-
119
-
120
-
121
-
122
-
 123
123 -
 124
124 -
 125
125 -
 126
126 -
 127
127 -
 128
128 -
 129
129 -
 130
130 -
 131
131 -
 132
132 -
 133
133 -
 134
134 -
 135
135 -
 136
136 -
 137
137 -
 138
138 -
 139
139 -
 140
140 -
 141
141 -
 142
142 -
 143
143 -
144
-
145
-
146
-
147
-
148
-
149
-
150
-
151
-
152
-
153
-
154
-
155
-
156
-
157
-
158
-
159
-
160
-
161
-
162
-
163
-
164
-
165
-
166
-
167
-
168
-
169
-
170
-
171
-
172
-
173
-
174
-
175
-
176
-
177
-
178
-
179
-
180
-
181
-
182
-
183
-
184
-
185
-
186
-
187
-
188
-
189
-
190
-
191
-
192
-
193
-
194
-
195
-
196
-
197
-
198
-
199
-
200
-
201
-
202
-
203
-
204
-
205
-
206
-
207
-
208
-
209
-
210
-
211
-
212
-
213
-
214
-
215
-
216
-
217
-
218
-
219
-
220
-
221
-
222
-
223
-
224
 |
 |

MetLife, Inc.
Notes to the Consolidated Financial Statements — (Continued)
8. Investments (continued)
collateral, expected prepayment speeds, current and forecasted loss severity, consideration of the payment terms of the underlying assets backing a
particular security, and the payment priority within the tranche structure of the security.
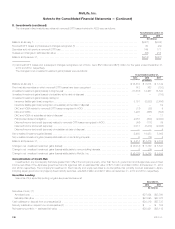
Equity Securities
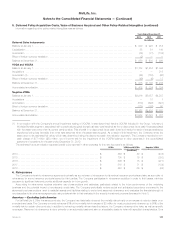
Gross unrealized losses on equity securities decreased $42 million during the year ended December 31, 2013 from $159 million to $117 million.
Of the $117 million, $39 million were from 11 equity securities with gross unrealized losses of 20% or more of cost for 12 months or greater, all of
which were financial services industry investment grade non-redeemable preferred stock, of which 65% were rated A or better.
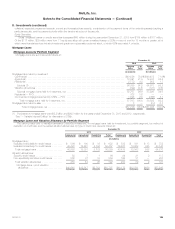
Mortgage Loans
Mortgage Loans by Portfolio Segment
Mortgage loans are summarized as follows at:
December 31,
2013 2012
Carrying % of Carrying % of
Value Total Value Total
(In millions) (In millions)
Mortgage loans held-for-investment:
Commercial ............................................................................. $40,926 70.9% $40,472 71.0%
Agricultural .............................................................................. 12,391 21.5 12,843 22.5
Residential .............................................................................. 2,772 4.8 958 1.7
Subtotal (1) ............................................................................ 56,089 97.2 54,273 95.2
Valuation allowances ...................................................................... (322) (0.6) (347) (0.6)
Subtotal mortgage loans held-for-investment, net .............................................. 55,767 96.6 53,926 94.6
Residential — FVO ........................................................................ 338 0.6 — —
Commercial mortgage loans held by CSEs — FVO .............................................. 1,598 2.8 2,666 4.7
Total mortgage loans held-for-investment, net ............................................... 57,703 100.0 56,592 99.3
Mortgage loans held-for-sale .................................................................. 3 — 414 0.7
Total mortgage loans, net ............................................................. $57,706 100.0% $57,006 100.0%
(1) Purchases of mortgage loans were $2.2 billion and $205 million for the years ended December 31, 2013 and 2012, respectively.
See “— Variable Interest Entities” for discussion of CSEs.
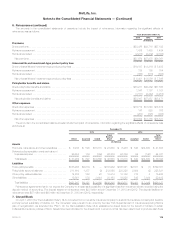
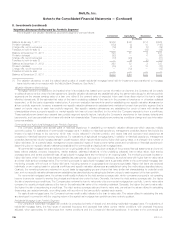
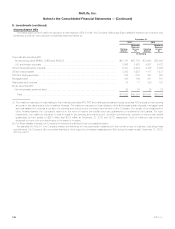
Mortgage Loans and Valuation Allowance by Portfolio Segment
The carrying value prior to valuation allowance (“recorded investment”) in mortgage loans held-for-investment, by portfolio segment, by method of
evaluation of credit loss, and the related valuation allowances, by type of credit loss, were as follows at:
December 31,
2013 2012
Commercial Agricultural Residential Total Commercial Agricultural Residential Total
(In millions)
Mortgage loans:
Evaluated individually for credit losses ........ $ 506 $ 100 $ 16 $ 622 $ 539 $ 181 $ 13 $ 733
Evaluated collectively for credit losses ........ 40,420 12,291 2,756 55,467 39,933 12,662 945 53,540
Total mortgage loans .................... 40,926 12,391 2,772 56,089 40,472 12,843 958 54,273
Valuation allowances:
Specific credit losses ..................... 58 7 1 66 94 21 2 117
Non-specifically identified credit losses ....... 200 37 19 256 199 31 — 230
Total valuation allowances ................ 258 44 20 322 293 52 2 347
Mortgage loans, net of valuation
allowance ........................... $40,668 $12,347 $2,752 $55,767 $40,179 $12,791 $956 $53,926
MetLife, Inc. 125