MetLife 2013 Annual Report Download - page 36
Download and view the complete annual report
Please find page 36 of the 2013 MetLife annual report below. You can navigate through the pages in the report by either clicking on the pages listed below, or by using the keyword search tool below to find specific information within the annual report.-
 1
1 -
2
-
3
-
4
-
5
-
6
-
7
-
8
-
9
-
10
-
11
-
12
-
13
-
14
-
15
-
16
-
17
-
18
-
19
-
20
-
21
-
22
-
23
-
24
-
25
-
 26
26 -
 27
27 -
 28
28 -
 29
29 -
 30
30 -
 31
31 -
 32
32 -
 33
33 -
 34
34 -
 35
35 -
 36
36 -
 37
37 -
 38
38 -
 39
39 -
 40
40 -
 41
41 -
 42
42 -
 43
43 -
 44
44 -
 45
45 -
 46
46 -
47
-
48
-
49
-
50
-
51
-
52
-
53
-
54
-
55
-
56
-
57
-
58
-
59
-
60
-
61
-
62
-
63
-
64
-
65
-
66
-
67
-
68
-
69
-
70
-
71
-
72
-
73
-
74
-
75
-
76
-
77
-
78
-
79
-
80
-
81
-
82
-
83
-
84
-
85
-
86
-
87
-
88
-
89
-
90
-
91
-
92
-
93
-
94
-
95
-
96
-
97
-
98
-
99
-
100
-
101
-
102
-
103
-
104
-
105
-
106
-
107
-
108
-
109
-
110
-
111
-
112
-
113
-
114
-
115
-
116
-
117
-
118
-
119
-
120
-
121
-
122
-
123
-
124
-
125
-
126
-
127
-
128
-
129
-
130
-
131
-
132
-
133
-
134
-
135
-
136
-
137
-
138
-
139
-
140
-
141
-
142
-
143
-
144
-
145
-
146
-
147
-
148
-
149
-
150
-
151
-
152
-
153
-
154
-
155
-
156
-
157
-
158
-
159
-
160
-
161
-
162
-
163
-
164
-
165
-
166
-
167
-
168
-
169
-
170
-
171
-
172
-
173
-
174
-
175
-
176
-
177
-
178
-
179
-
180
-
181
-
182
-
183
-
184
-
185
-
186
-
187
-
188
-
189
-
190
-
191
-
192
-
193
-
194
-
195
-
196
-
197
-
198
-
199
-
200
-
201
-
202
-
203
-
204
-
205
-
206
-
207
-
208
-
209
-
210
-
211
-
212
-
213
-
214
-
215
-
216
-
217
-
218
-
219
-
220
-
221
-
222
-
223
-
224
 |
 |

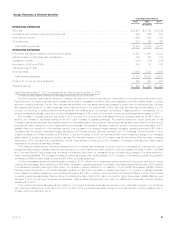
We experienced less favorable mortality in our Group, Voluntary & Worksite Benefits and Retail segments. In our Group, Voluntary & Worksite
Benefits segment, mixed claims experience with a net unfavorable result was driven by an increase in claims incidence. In our property & casualty
businesses, catastrophe-related losses decreased as compared to 2012, primarily due to Superstorm Sandy in 2012; however, this was partially
offset by an increase in non-catastrophe claim costs, which were primarily the result of higher frequencies. The combined impact of mortality and
claims experience decreased operating earnings by $101 million.
On an annual basis, we review and update our long-term assumptions used in our calculations of certain insurance-related liabilities and DAC.
These annual updates resulted in a $20 million increase in operating earnings primarily driven by the Asia segment. In addition to our annual updates,
other adjustments and DAC refinements were recorded in both 2013 and 2012 and resulted in a $21 million decrease in operating earnings. Also, as
a result of a review of our own recent claims experience, and in consideration of the worsening trend for the industry in Australia, we strengthened our
group total and permanent disability claim reserves in Australia, which reduced operating earnings by $57 million.
In addition, an increase in operating expenses, primarily employee-related costs, was partially offset by a decline in expenses, most notably in our
Retail segment, primarily driven by savings from the Company’s enterprise-wide strategic initiative and resulted in an $89 million decrease in operating
earnings.
The Company’s effective tax rate differs from the U.S. statutory rate of 35% primarily due to non-taxable investment income, tax credits for low
income housing, and foreign earnings taxed at lower rates than the U.S. statutory rate. In 2013, the Company realized additional tax benefits of
$187 million compared to 2012, primarily from the higher utilization of tax preferenced investments and the Company’s decision to permanently
reinvest certain foreign earnings.
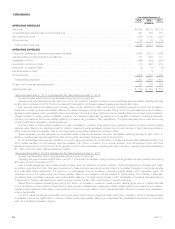
Year Ended December 31, 2012 Compared with the Year Ended December 31, 2011
Unless otherwise stated, all amounts discussed below are net of income tax.
Higher policy fee income, stronger investment results and favorable claims experience were the primary drivers of the increase in operating
earnings. In addition, the year ended December 31, 2011 included a $117 million charge in connection with our use of the U.S. Social Security
Administration’s Death Master File. These positive impacts on operating earnings were partially offset by a $52 million charge taken in the first quarter
of 2012 representing a multi–state examination payment related to unclaimed property and our use of the U.S. Social Security Administration’s Death
Master File to identify potential life insurance claims, as well as the expected acceleration of benefit payments to policyholders under the settlements.
In addition, changes in foreign currency exchange rates had a $56 million negative impact on results compared to 2011.
We benefited from strong sales, as well as growth and higher persistency in our business across many of our products. In our Retail segment, we
implemented extensive changes to product pricing and variable annuity guarantee features which resulted in a significant decrease in variable annuity
sales. However, as a result of stronger sales of variable annuities in 2011, we experienced growth in both our average separate account assets and
our investment portfolio. The growth in the average separate account assets generated higher policy fee income of $384 million. The growth in our
investment portfolio generated higher net investment income of $384 million. Since many of our products are interest spread–based, the increase in
net investment income was partially offset by a $345 million increase in interest credited expense, most notably in the Corporate Benefit Funding and
Asia segments. The decline in variable annuity sales also resulted in a decrease in commissions, despite higher sales from our international
businesses, which was partially offset by a decrease in related DAC capitalization which, combined, resulted in a $122 million increase to operating
earnings. In addition, other non-variable expenses increased $310 million and our annuity business growth in 2011 was the primary driver of higher
DAC amortization of $175 million in 2012. Higher premiums partially offset by higher policyholder benefits in our international segments improved
operating earnings by $93 million.
The low interest rate environment continued to result in lower interest credited expense as we set interest credited rates lower on both new
business, as well as on certain in-force business with rate resets that are contractually tied to external indices or contain discretionary rate reset
provisions. The improving equity markets resulted in lower DAC amortization and higher fee income in our annuity business. Improved investment
yields, excluding the Divested Businesses, were driven by the repositioning of the Japan portfolio, growth in higher yielding portfolios in the Asia and
EMEA segments, the impact of inflation-indexed investments in the Latin America segment, higher derivatives income primarily from interest rate floors
and interest rate swaps entered into prior to the onset of the low interest rate environment, and increased private equity income from improving equity
markets. These improvements were partially offset by the unfavorable impact of the low interest rate environment on our fixed-income investments.
Changes in market factors discussed above resulted in a $441 million increase in operating earnings.
Lower severity of property & casualty catastrophe claims in 2012 increased operating earnings by $105 million as a result of severe storm activity in
2011, which was greater than the impact of severe storm activity in 2012, primarily the result of Superstorm Sandy. Less favorable mortality results in
our Group, Voluntary & Worksite Benefits segment and unfavorable mortality in our Asia and Corporate Benefit Funding segments, was partially offset
by favorable mortality in our Retail segment. In addition, claims experience varied across our products with a net favorable result driven by a decrease
in claims in our Group, Voluntary & Worksite Benefits segment. The combined impact of mortality and claims experience decreased operating earnings
by $79 million.
Liability and DAC refinements in both 2012 and 2011, primarily from our Retail, Asia and Group, Voluntary & Worksite Benefits segments, resulted
in a $190 million net increase in operating earnings. In addition, the year ended December 31, 2011 included $40 million of expenses incurred related
to a liquidation plan filed by the Department of Financial Services for ELNY and $39 million of insurance claims and operating expenses related to the
March 2011 earthquake and tsunami in Japan. The year ended December 31, 2012 included $103 million of employee–related and other costs
associated with the Company’s enterprise-wide strategic initiative and a $50 million impairment charge on an intangible asset related to a previously
acquired dental business.
The Company benefited from the impact of certain permanent tax differences, including non-taxable investment income and tax credits for
investments in low income housing. As a result, our effective tax rates differ from the U.S. statutory rate of 35%. In 2012, we benefited primarily from
higher utilization of tax preferenced investments, which improved operating earnings by $65 million over 2011.
28 MetLife, Inc.