MetLife 2013 Annual Report Download - page 53
Download and view the complete annual report
Please find page 53 of the 2013 MetLife annual report below. You can navigate through the pages in the report by either clicking on the pages listed below, or by using the keyword search tool below to find specific information within the annual report.-
 1
1 -
2
-
3
-
4
-
5
-
6
-
7
-
8
-
9
-
10
-
11
-
12
-
13
-
14
-
15
-
16
-
17
-
18
-
19
-
20
-
21
-
22
-
23
-
24
-
25
-
26
-
27
-
28
-
29
-
30
-
31
-
32
-
33
-
34
-
35
-
36
-
37
-
38
-
39
-
40
-
41
-
42
-
 43
43 -
 44
44 -
 45
45 -
 46
46 -
 47
47 -
 48
48 -
 49
49 -
 50
50 -
 51
51 -
 52
52 -
 53
53 -
 54
54 -
 55
55 -
 56
56 -
 57
57 -
 58
58 -
 59
59 -
 60
60 -
 61
61 -
 62
62 -
 63
63 -
64
-
65
-
66
-
67
-
68
-
69
-
70
-
71
-
72
-
73
-
74
-
75
-
76
-
77
-
78
-
79
-
80
-
81
-
82
-
83
-
84
-
85
-
86
-
87
-
88
-
89
-
90
-
91
-
92
-
93
-
94
-
95
-
96
-
97
-
98
-
99
-
100
-
101
-
102
-
103
-
104
-
105
-
106
-
107
-
108
-
109
-
110
-
111
-
112
-
113
-
114
-
115
-
116
-
117
-
118
-
119
-
120
-
121
-
122
-
123
-
124
-
125
-
126
-
127
-
128
-
129
-
130
-
131
-
132
-
133
-
134
-
135
-
136
-
137
-
138
-
139
-
140
-
141
-
142
-
143
-
144
-
145
-
146
-
147
-
148
-
149
-
150
-
151
-
152
-
153
-
154
-
155
-
156
-
157
-
158
-
159
-
160
-
161
-
162
-
163
-
164
-
165
-
166
-
167
-
168
-
169
-
170
-
171
-
172
-
173
-
174
-
175
-
176
-
177
-
178
-
179
-
180
-
181
-
182
-
183
-
184
-
185
-
186
-
187
-
188
-
189
-
190
-
191
-
192
-
193
-
194
-
195
-
196
-
197
-
198
-
199
-
200
-
201
-
202
-
203
-
204
-
205
-
206
-
207
-
208
-
209
-
210
-
211
-
212
-
213
-
214
-
215
-
216
-
217
-
218
-
219
-
220
-
221
-
222
-
223
-
224
 |
 |

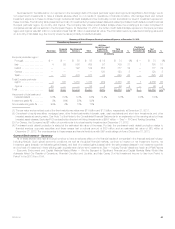
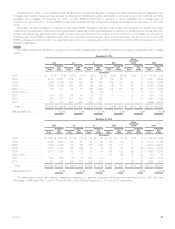
The following table presents total fixed maturity securities by NRSRO rating and the equivalent designations of the NAIC, except for certain structured
securities, which are presented using the revised NAIC methodologies as described above, as well as the percentage, based on estimated fair value
that each designation is comprised of at:
December 31,
2013 2012
NAIC
Designation Rating Agency Rating Amortized
Cost Unrealized
Gain (Loss)
Estimated
Fair
Value %of
Total Amortized
Cost Unrealized
Gain (Loss)
Estimated
Fair
Value %of
Total
(In millions) (In millions)
1 Aaa/Aa/A ................................... $230,429 $ 11,640 $242,069 69.1% $234,371 $ 24,197 $258,568 69.1%
2 Baa ....................................... 79,732 4,382 84,114 24.0 81,530 8,663 90,193 24.1
Subtotal investment grade .................... 310,161 16,022 326,183 93.1 315,901 32,860 348,761 93.2
3 Ba ........................................ 13,239 358 13,597 3.9 13,882 552 14,434 3.8
4 B ......................................... 9,216 162 9,378 2.7 9,470 137 9,607 2.6
5 Caa and lower ............................... 932 23 955 0.3 1,543 (164) 1,379 0.4
6 In or near default ............................. 51 23 74 — 74 11 85 —
Subtotal below investment grade ............... 23,438 566 24,004 6.9 24,969 536 25,505 6.8
Total fixed maturity securities ................ $333,599 $ 16,588 $350,187 100.0% $340,870 $ 33,396 $374,266 100.0%
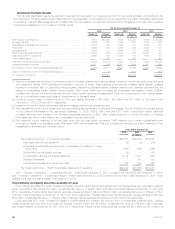
The following tables present total fixed maturity securities, based on estimated fair value, by sector classification and by NRSRO rating and the
equivalent designations of the NAIC, except for certain structured securities, which are presented using the NAIC methodologies as described above:
Fixed Maturity Securities — by Sector & Credit Quality Rating
NAIC Designation: 1 2 3 4 5 6 Total
Estimated
Fair ValueRating Agency Rating: Aaa/Aa/A Baa Ba B Caa and
Lower In or Near
Default
(In millions)
December 31, 2013:
U.S. corporate ............................................ $ 46,038 $45,639 $ 9,349 $4,998 $ 415 $ 30 $106,469
Foreign corporate .......................................... 27,957 30,477 2,762 1,910 45 1 63,152
Foreign government ........................................ 47,767 4,481 648 1,363 178 — 54,437
U.S. Treasury and agency ................................... 45,123 — — — — — 45,123
RMBS ................................................... 31,385 1,657 753 974 248 38 35,055
CMBS .................................................. 16,393 47 45 14 51 — 16,550
ABS .................................................... 14,184 1,215 30 119 18 5 15,571
State and political subdivision ................................. 13,222 598 10 — — — 13,830
Total fixed maturity securities ............................... $242,069 $84,114 $13,597 $9,378 $ 955 $ 74 $350,187
Percentage of total ....................................... 69.1% 24.0% 3.9% 2.7% 0.3% —% 100.0%
December 31, 2012:
U.S. corporate ............................................ $ 51,648 $48,622 $ 8,597 $4,831 $ 380 $ 48 $114,126
Foreign corporate .......................................... 31,937 30,509 3,249 1,418 66 5 67,184
Foreign government ........................................ 46,314 8,501 933 1,504 84 — 57,336
U.S. Treasury and agency ................................... 47,967 — — — — — 47,967
RMBS ................................................... 32,377 894 1,582 1,809 790 27 37,479
CMBS .................................................. 18,843 193 43 11 39 — 19,129
ABS .................................................... 15,247 673 18 34 20 5 15,997
State and political subdivision ................................. 14,235 801 12 — — — 15,048
Total fixed maturity securities ............................... $258,568 $90,193 $14,434 $9,607 $1,379 $ 85 $374,266
Percentage of total ....................................... 69.1% 24.1% 3.8% 2.6% 0.4% —% 100.0%
MetLife, Inc. 45