MetLife 2013 Annual Report Download - page 43
Download and view the complete annual report
Please find page 43 of the 2013 MetLife annual report below. You can navigate through the pages in the report by either clicking on the pages listed below, or by using the keyword search tool below to find specific information within the annual report.-
 1
1 -
2
-
3
-
4
-
5
-
6
-
7
-
8
-
9
-
10
-
11
-
12
-
13
-
14
-
15
-
16
-
17
-
18
-
19
-
20
-
21
-
22
-
23
-
24
-
25
-
26
-
27
-
28
-
29
-
30
-
31
-
32
-
 33
33 -
 34
34 -
 35
35 -
 36
36 -
 37
37 -
 38
38 -
 39
39 -
 40
40 -
 41
41 -
 42
42 -
 43
43 -
 44
44 -
 45
45 -
 46
46 -
 47
47 -
 48
48 -
 49
49 -
 50
50 -
 51
51 -
 52
52 -
 53
53 -
54
-
55
-
56
-
57
-
58
-
59
-
60
-
61
-
62
-
63
-
64
-
65
-
66
-
67
-
68
-
69
-
70
-
71
-
72
-
73
-
74
-
75
-
76
-
77
-
78
-
79
-
80
-
81
-
82
-
83
-
84
-
85
-
86
-
87
-
88
-
89
-
90
-
91
-
92
-
93
-
94
-
95
-
96
-
97
-
98
-
99
-
100
-
101
-
102
-
103
-
104
-
105
-
106
-
107
-
108
-
109
-
110
-
111
-
112
-
113
-
114
-
115
-
116
-
117
-
118
-
119
-
120
-
121
-
122
-
123
-
124
-
125
-
126
-
127
-
128
-
129
-
130
-
131
-
132
-
133
-
134
-
135
-
136
-
137
-
138
-
139
-
140
-
141
-
142
-
143
-
144
-
145
-
146
-
147
-
148
-
149
-
150
-
151
-
152
-
153
-
154
-
155
-
156
-
157
-
158
-
159
-
160
-
161
-
162
-
163
-
164
-
165
-
166
-
167
-
168
-
169
-
170
-
171
-
172
-
173
-
174
-
175
-
176
-
177
-
178
-
179
-
180
-
181
-
182
-
183
-
184
-
185
-
186
-
187
-
188
-
189
-
190
-
191
-
192
-
193
-
194
-
195
-
196
-
197
-
198
-
199
-
200
-
201
-
202
-
203
-
204
-
205
-
206
-
207
-
208
-
209
-
210
-
211
-
212
-
213
-
214
-
215
-
216
-
217
-
218
-
219
-
220
-
221
-
222
-
223
-
224
 |
 |

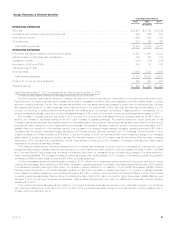
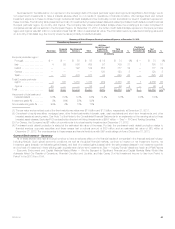
Asia
Years Ended December 31,
2013 2012 2011
(In millions)
OPERATING REVENUES
Premiums .................................................................................... $ 7,801 $ 8,344 $ 7,716
Universal life and investment-type product policy fees .................................................. 1,722 1,491 1,343
Net investment income .......................................................................... 2,915 2,895 2,475
Other revenues ................................................................................ 92 26 36
Total operating revenues ...................................................................... 12,530 12,756 11,570
OPERATING EXPENSES
Policyholder benefits and claims and policyholder dividends ............................................. 5,755 5,819 5,239
Interest credited to policyholder account balances .................................................... 1,690 1,784 1,607
Capitalization of DAC ........................................................................... (2,143) (2,288) (2,045)
Amortization of DAC and VOBA ................................................................... 1,542 1,563 1,486
Amortization of negative VOBA .................................................................... (427) (456) (560)
Interest expense on debt ........................................................................ — 5 —
Other expenses ............................................................................... 4,312 4,738 4,522
Total operating expenses ...................................................................... 10,729 11,165 10,249
Provision for income tax expense (benefit) ........................................................... 557 554 441
Operating earnings ............................................................................. $ 1,244 $ 1,037 $ 880
Year Ended December 31, 2013 Compared with the Year Ended December 31, 2012
Unless otherwise stated, all amounts discussed below are net of income tax.
Operating earnings increased by $207 million over 2012. The impact of changes in foreign currency exchange rates reduced operating earnings
by $55 million for 2013 as compared to 2012 and resulted in significant variances in the financial statement line items.
Asia sales grew 8% over 2012. Modest sales growth in Japan was driven by life product sales in the second half of 2013 which more than offset
the impact of customers shifting away from foreign currency-denominated retirement products due to a weakening yen and capital market volatility
resulting in lower fixed annuity sales and higher surrenders. In the fourth quarter of 2013, we obtained a major contract to provide group insurance for
a certain pension fund, which drove an increase in sales over 2012 in Australia. Group sales are significantly influenced by large transactions and, as
a result, can fluctuate from period to period. Sales during 2013 benefited from growth in both China, a result of strong accident & health sales, and
India, as production benefited from our relationship with Punjab National Bank and strong sales in the agency channel.
Asia’s premiums and fee income increased over 2012 primarily driven by broad based in-force growth across the region, including growth of
ordinary life and accident & health products in Japan, group insurance in Australia, and growth of ordinary life products in Korea and India. Higher
surrenders of fixed annuity products in Japan, driven by market conditions, also contributed to higher fee income, higher DAC amortization and a
decrease in interest credited to policyholders as surrenders exceeded new business volume. Changes in premiums for these businesses were offset
by related changes in policyholder benefits. Positive net flows in Japan and Bangladesh resulted in an increase in average invested assets over 2012,
generating an increase in net investment income. The combined impact of the items discussed above improved operating earnings by $113 million.
Investment yields increased from the continued repositioning of the Japan investment portfolio to higher yielding investments, higher prepayment
fees and improved results from real estate joint ventures. This was partially offset by lower returns on other limited partnership interests. These
improvements in investment yields, combined with the positive impact of foreign currency hedges, increased operating earnings by $92 million.
On an annual basis, we review and update our long-term assumptions used in our calculations of certain insurance-related liabilities and DAC.
The combined impact of the 2013 and 2012 annual updates resulted in a net operating earnings increase of $56 million. Also in 2013, as a result of
a review of our own recent claims experience, and in consideration of the worsening trend for the industry in Australia, we strengthened our group
total and permanent disability claim reserves in Australia, which reduced operating earnings by $57 million, net of reinsurance.
The 2013 results include a $38 million tax benefit recorded in Japan related to the reversal of temporary differences and a reduction in the
effective tax rate. The 2013 results also include a $10 million one-time tax benefit related to the release of certain reserves and the disposal of our
interest in a Korea asset management company at the beginning of 2013. In addition, 2012 results include a one-time tax expense of $16 million,
including the adjustment of net operating loss carryforwards in Hong Kong.
Year Ended December 31, 2012 Compared with the Year Ended December 31, 2011
Unless otherwise stated, all amounts discussed below are net of income tax.
Operating earnings increased by $157 million over 2011. The impact of changes in foreign currency exchange rates reduced operating earnings
by $3 million for 2012 compared to 2011.
Asia experienced sales growth in ordinary and universal life products in Japan, resulting in higher premiums and universal life fees, and variable life
and accident & health products in Korea, which drove higher fees over 2011. Changes in premiums for these businesses were partially offset by
related changes in policyholder benefits. In addition, average invested assets increased over 2011, reflecting positive cash flows from our annuity
business in Japan generating increases in both net investment income and policy fee income, partially offset by an increase in interest credited to
policyholders. The increase in sales also generated higher commissions and other sales-related expenses, which were partially offset by an increase
in related DAC capitalization. The combined impact of the items discussed above improved operating earnings by $99 million.
MetLife, Inc. 35