MetLife 2013 Annual Report Download - page 175
Download and view the complete annual report
Please find page 175 of the 2013 MetLife annual report below. You can navigate through the pages in the report by either clicking on the pages listed below, or by using the keyword search tool below to find specific information within the annual report.-
 1
1 -
2
-
3
-
4
-
5
-
6
-
7
-
8
-
9
-
10
-
11
-
12
-
13
-
14
-
15
-
16
-
17
-
18
-
19
-
20
-
21
-
22
-
23
-
24
-
25
-
26
-
27
-
28
-
29
-
30
-
31
-
32
-
33
-
34
-
35
-
36
-
37
-
38
-
39
-
40
-
41
-
42
-
43
-
44
-
45
-
46
-
47
-
48
-
49
-
50
-
51
-
52
-
53
-
54
-
55
-
56
-
57
-
58
-
59
-
60
-
61
-
62
-
63
-
64
-
65
-
66
-
67
-
68
-
69
-
70
-
71
-
72
-
73
-
74
-
75
-
76
-
77
-
78
-
79
-
80
-
81
-
82
-
83
-
84
-
85
-
86
-
87
-
88
-
89
-
90
-
91
-
92
-
93
-
94
-
95
-
96
-
97
-
98
-
99
-
100
-
101
-
102
-
103
-
104
-
105
-
106
-
107
-
108
-
109
-
110
-
111
-
112
-
113
-
114
-
115
-
116
-
117
-
118
-
119
-
120
-
121
-
122
-
123
-
124
-
125
-
126
-
127
-
128
-
129
-
130
-
131
-
132
-
133
-
134
-
135
-
136
-
137
-
138
-
139
-
140
-
141
-
142
-
143
-
144
-
145
-
146
-
147
-
148
-
149
-
150
-
151
-
152
-
153
-
154
-
155
-
156
-
157
-
158
-
159
-
160
-
161
-
162
-
163
-
164
-
 165
165 -
 166
166 -
 167
167 -
 168
168 -
 169
169 -
 170
170 -
 171
171 -
 172
172 -
 173
173 -
 174
174 -
 175
175 -
 176
176 -
 177
177 -
 178
178 -
 179
179 -
 180
180 -
 181
181 -
 182
182 -
 183
183 -
 184
184 -
 185
185 -
186
-
187
-
188
-
189
-
190
-
191
-
192
-
193
-
194
-
195
-
196
-
197
-
198
-
199
-
200
-
201
-
202
-
203
-
204
-
205
-
206
-
207
-
208
-
209
-
210
-
211
-
212
-
213
-
214
-
215
-
216
-
217
-
218
-
219
-
220
-
221
-
222
-
223
-
224
 |
 |

MetLife, Inc.
Notes to the Consolidated Financial Statements — (Continued)
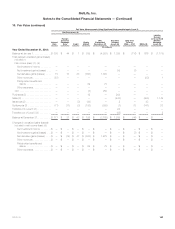
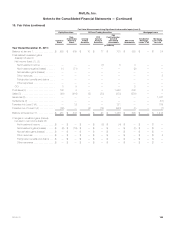
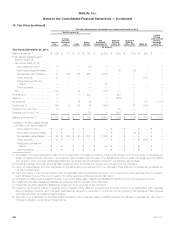
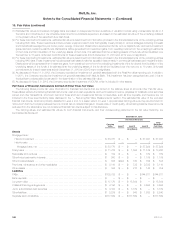
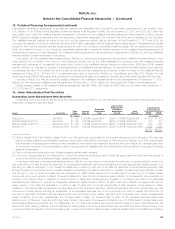
10. Fair Value (continued)
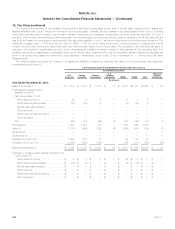
Fair Value Option
The following table presents information for certain assets and liabilities accounted for under the FVO. These assets and liabilities were initially
measured at fair value.
Residential Mortgage
Loans — FVO (1)
Certain Assets
and Liabilities
of CSEs (2)
December 31, December 31,
2013 2012 2013 2012
(In millions)
Assets
Unpaid principal balance ................................................................... $508 $— $1,528 $2,539
Difference between estimated fair value and unpaid principal balance ................................ (170) — 70 127
Carrying value at estimated fair value ....................................................... $338 $— $1,598 $2,666
Loans in non-accrual status ................................................................ $ — $— $ — $ —
Loans more than 90 days past due .......................................................... $ 81 $— $ — $ —
Loans in non-accrual status or more than 90 days past due, or both — difference between aggregate
estimated fair value and unpaid principal balance .............................................. $ (82) $— $ — $ —
Liabilities
Contractual principal balance ............................................................... $1,445 $2,430
Difference between estimated fair value and contractual principal balance ............................. 10 97
Carrying value at estimated fair value ....................................................... $1,455 $2,527
(1) Interest income, changes in estimated fair value and gains or losses on sales are recognized in net investment income. Changes in estimated fair
value for these loans were due to the following: Years Ended
December 31,
2013 2012 2011
(In millions)
Instrument-specific credit risk based on changes in credit spreads for non-agency loans and adjustments in individual loan
quality .............................................................................................. $(1) $— $—
Other changes in estimated fair value ....................................................................... 1 — —
Total gains (losses) recognized in net investment income ...................................................... $— $— $—
(2) These assets and liabilities are comprised of commercial mortgage loans and long-term debt. Changes in estimated fair value on these assets and
liabilities and gains or losses on sales of these assets are recognized in net investment gains (losses). Interest income on commercial mortgage
loans held by CSEs — FVO is recognized in net investment income. Interest expense from long-term debt of CSEs — FVO is recognized in other
expenses.
The Company also held $49 million of mortgage loans held-for-sale — FVO at December 31, 2012. Changes in estimated fair value are recognized
as gains in other revenues. Changes in fair value due to instrument-specific credit risk were less than ($1) million, ($1) million, and ($3) million for the
years ended December 31, 2013, 2012 and 2011, respectively. Other changes in estimated fair value were less than $1 million, $68 million and
$511 million for the years ended December 31, 2013, 2012 and 2011, respectively.
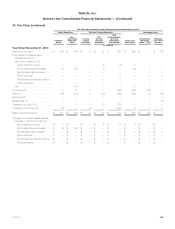
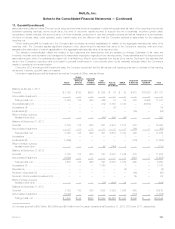
Nonrecurring Fair Value Measurements
The following table presents information for assets measured at estimated fair value on a nonrecurring basis during the periods and still held at the
reporting dates; that is, they are not measured at fair value on a recurring basis but are subject to fair value adjustments only in certain circumstances
(for example, when there is evidence of impairment). The estimated fair values for these assets were determined using significant unobservable
inputs (Level 3).
At December 31, Years Ended
December 31,
2013 2012 2011 2013 2012 2011
Carrying Value After
Measurement Gains (Losses)
(In millions)
Mortgage loans: (1)
Held-for-investment .............................................................. $211 $428 $151 $ 20 $ (11) $(15)
Held-for-sale ................................................................... $ 3 $319 $ 58 $ — $ (31) $ (3)
Other limited partnership interests (2) .................................................. $ 77 $ 54 $ 13 $(46) $ (33) $ (5)
Real estate joint ventures (3) ......................................................... $ 3 $ 10 $ — $ (2) $ (6) $ —
Goodwill (4) ...................................................................... $ — $ — $ — $— $(1,868) $(65)
Other assets (5) .................................................................. $ — $ 32 $ — $ — $ (77) $ —
MetLife, Inc. 167