MetLife 2013 Annual Report Download - page 131
Download and view the complete annual report
Please find page 131 of the 2013 MetLife annual report below. You can navigate through the pages in the report by either clicking on the pages listed below, or by using the keyword search tool below to find specific information within the annual report.-
 1
1 -
2
-
3
-
4
-
5
-
6
-
7
-
8
-
9
-
10
-
11
-
12
-
13
-
14
-
15
-
16
-
17
-
18
-
19
-
20
-
21
-
22
-
23
-
24
-
25
-
26
-
27
-
28
-
29
-
30
-
31
-
32
-
33
-
34
-
35
-
36
-
37
-
38
-
39
-
40
-
41
-
42
-
43
-
44
-
45
-
46
-
47
-
48
-
49
-
50
-
51
-
52
-
53
-
54
-
55
-
56
-
57
-
58
-
59
-
60
-
61
-
62
-
63
-
64
-
65
-
66
-
67
-
68
-
69
-
70
-
71
-
72
-
73
-
74
-
75
-
76
-
77
-
78
-
79
-
80
-
81
-
82
-
83
-
84
-
85
-
86
-
87
-
88
-
89
-
90
-
91
-
92
-
93
-
94
-
95
-
96
-
97
-
98
-
99
-
100
-
101
-
102
-
103
-
104
-
105
-
106
-
107
-
108
-
109
-
110
-
111
-
112
-
113
-
114
-
115
-
116
-
117
-
118
-
119
-
120
-
 121
121 -
 122
122 -
 123
123 -
 124
124 -
 125
125 -
 126
126 -
 127
127 -
 128
128 -
 129
129 -
 130
130 -
 131
131 -
 132
132 -
 133
133 -
 134
134 -
 135
135 -
 136
136 -
 137
137 -
 138
138 -
 139
139 -
 140
140 -
 141
141 -
142
-
143
-
144
-
145
-
146
-
147
-
148
-
149
-
150
-
151
-
152
-
153
-
154
-
155
-
156
-
157
-
158
-
159
-
160
-
161
-
162
-
163
-
164
-
165
-
166
-
167
-
168
-
169
-
170
-
171
-
172
-
173
-
174
-
175
-
176
-
177
-
178
-
179
-
180
-
181
-
182
-
183
-
184
-
185
-
186
-
187
-
188
-
189
-
190
-
191
-
192
-
193
-
194
-
195
-
196
-
197
-
198
-
199
-
200
-
201
-
202
-
203
-
204
-
205
-
206
-
207
-
208
-
209
-
210
-
211
-
212
-
213
-
214
-
215
-
216
-
217
-
218
-
219
-
220
-
221
-
222
-
223
-
224
 |
 |

MetLife, Inc.
Notes to the Consolidated Financial Statements — (Continued)
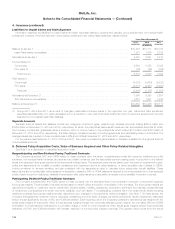
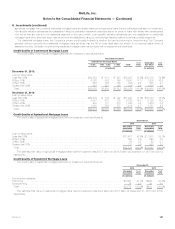
8. Investments (continued)
(1) The noncredit loss component of OTTI losses for foreign corporate securities was in an unrealized gain position of $1 million at December 31,
2012, due to increases in estimated fair value subsequent to initial recognition of noncredit losses on such securities. See also “— Net Unrealized
Investment Gains (Losses).”
The Company held non-income producing fixed maturity securities with an estimated fair value of $74 million and $85 million with unrealized
gains (losses) of $23 million and $11 million at December 31, 2013 and 2012, respectively.
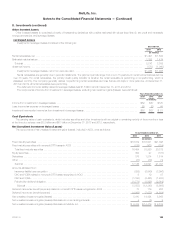
Methodology for Amortization of Premium and Accretion of Discount on Structured Securities
Amortization of premium and accretion of discount on structured securities considers the estimated timing and amount of prepayments of the
underlying loans. Actual prepayment experience is periodically reviewed and effective yields are recalculated when differences arise between the
originally anticipated and the actual prepayments received and currently anticipated. Prepayment assumptions for single class and multi-class
mortgage-backed and ABS are estimated using inputs obtained from third-party specialists and based on management’s knowledge of the current
market. For credit-sensitive mortgage-backed and ABS and certain prepayment-sensitive securities, the effective yield is recalculated on a prospective
basis. For all other mortgage-backed and ABS, the effective yield is recalculated on a retrospective basis.
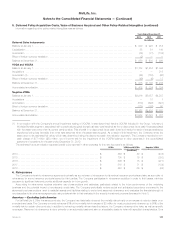
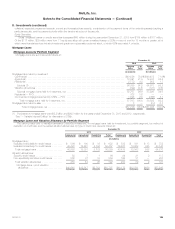
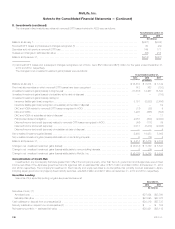
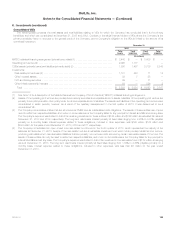
Maturities of Fixed Maturity Securities
The amortized cost and estimated fair value of fixed maturity securities, by contractual maturity date, were as follows at:
December 31,
2013 2012
Amortized
Cost
Estimated
Fair
Value Amortized
Cost
Estimated
Fair
Value
(In millions)
Due in one year or less ............................................................ $ 15,828 $ 16,030 $ 24,177 $ 24,394
Due after one year through five years ................................................. 70,467 74,229 66,973 70,759
Due after five years through ten years ................................................. 78,159 83,223 82,376 91,975
Due after ten years ............................................................... 103,405 109,529 97,739 114,533
Subtotal....................................................................... 267,859 283,011 271,265 301,661
Structured securities (RMBS, CMBS and ABS) .......................................... 65,740 67,176 69,605 72,605
Total fixed maturity securities ...................................................... $333,599 $350,187 $340,870 $374,266
Actual maturities may differ from contractual maturities due to the exercise of call or prepayment options. Fixed maturity securities not due at a
single maturity date have been presented in the year of final contractual maturity. RMBS, CMBS and ABS are shown separately, as they are not due at
a single maturity.
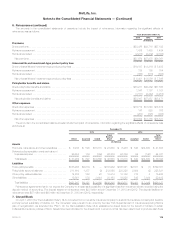
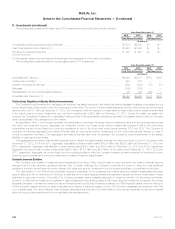
Continuous Gross Unrealized Losses for Fixed Maturity and Equity Securities AFS by Sector
The following table presents the estimated fair value and gross unrealized losses of fixed maturity and equity securities AFS in an unrealized loss
position, aggregated by sector and by length of time that the securities have been in a continuous unrealized loss position.
December 31, 2013 December 31, 2012
Less than 12 Months Equal to or Greater
than 12 Months Less than 12 Months Equal to or Greater
than 12 Months
Estimated
Fair
Value
Gross
Unrealized
Losses
Estimated
Fair
Value
Gross
Unrealized
Losses
Estimated
Fair
Value
Gross
Unrealized
Losses
Estimated
Fair
Value
Gross
Unrealized
Losses
(In millions, except number of securities)
Fixed maturity securities
U.S. corporate ................................ $13,889 $ 808 $ 3,807 $ 421 $ 3,799 $ 88 $ 3,695 $ 342
Foreign corporate .............................. 9,019 402 2,320 163 2,783 96 2,873 180
Foreign government ............................ 5,052 336 1,846 51 1,431 22 543 49
U.S. Treasury and agency ....................... 15,225 1,037 357 19 1,951 11 — —
RMBS ....................................... 10,754 363 2,302 333 735 31 4,098 633
CMBS ....................................... 3,696 142 631 28 842 11 577 46
ABS ........................................ 3,772 59 978 124 1,920 30 1,410 139
State and political subdivision ..................... 3,109 225 351 81 260 4 251 66
Total fixed maturity securities .................... $64,516 $3,372 $12,592 $1,220 $13,721 $293 $13,447 $1,455
Equity securities
Common stock ................................ $ 81 $ 4 $ 16 $ 1 $ 201 $ 18 $ 14 $ 1
Non-redeemable preferred stock .................. 364 65 191 47 — — 295 140
Total equity securities .......................... $ 445 $ 69 $ 207 $ 48 $ 201 $ 18 $ 309 $ 141
Total number of securities in an unrealized loss
position .................................... 4,480 1,571 1,941 1,335
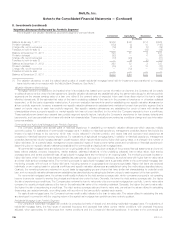
Evaluation of AFS Securities for OTTI and Evaluating Temporarily Impaired AFS Securities
Evaluation and Measurement Methodologies
Management considers a wide range of factors about the security issuer and uses its best judgment in evaluating the cause of the decline in the
estimated fair value of the security and in assessing the prospects for near-term recovery. Inherent in management’s evaluation of the security are
assumptions and estimates about the operations of the issuer and its future earnings potential. Considerations used in the impairment evaluation
MetLife, Inc. 123