MetLife 2013 Annual Report Download - page 24
Download and view the complete annual report
Please find page 24 of the 2013 MetLife annual report below. You can navigate through the pages in the report by either clicking on the pages listed below, or by using the keyword search tool below to find specific information within the annual report.-
 1
1 -
2
-
3
-
4
-
5
-
6
-
7
-
8
-
9
-
10
-
11
-
12
-
13
-
 14
14 -
 15
15 -
 16
16 -
 17
17 -
 18
18 -
 19
19 -
 20
20 -
 21
21 -
 22
22 -
 23
23 -
 24
24 -
 25
25 -
 26
26 -
 27
27 -
 28
28 -
 29
29 -
 30
30 -
 31
31 -
 32
32 -
 33
33 -
 34
34 -
35
-
36
-
37
-
38
-
39
-
40
-
41
-
42
-
43
-
44
-
45
-
46
-
47
-
48
-
49
-
50
-
51
-
52
-
53
-
54
-
55
-
56
-
57
-
58
-
59
-
60
-
61
-
62
-
63
-
64
-
65
-
66
-
67
-
68
-
69
-
70
-
71
-
72
-
73
-
74
-
75
-
76
-
77
-
78
-
79
-
80
-
81
-
82
-
83
-
84
-
85
-
86
-
87
-
88
-
89
-
90
-
91
-
92
-
93
-
94
-
95
-
96
-
97
-
98
-
99
-
100
-
101
-
102
-
103
-
104
-
105
-
106
-
107
-
108
-
109
-
110
-
111
-
112
-
113
-
114
-
115
-
116
-
117
-
118
-
119
-
120
-
121
-
122
-
123
-
124
-
125
-
126
-
127
-
128
-
129
-
130
-
131
-
132
-
133
-
134
-
135
-
136
-
137
-
138
-
139
-
140
-
141
-
142
-
143
-
144
-
145
-
146
-
147
-
148
-
149
-
150
-
151
-
152
-
153
-
154
-
155
-
156
-
157
-
158
-
159
-
160
-
161
-
162
-
163
-
164
-
165
-
166
-
167
-
168
-
169
-
170
-
171
-
172
-
173
-
174
-
175
-
176
-
177
-
178
-
179
-
180
-
181
-
182
-
183
-
184
-
185
-
186
-
187
-
188
-
189
-
190
-
191
-
192
-
193
-
194
-
195
-
196
-
197
-
198
-
199
-
200
-
201
-
202
-
203
-
204
-
205
-
206
-
207
-
208
-
209
-
210
-
211
-
212
-
213
-
214
-
215
-
216
-
217
-
218
-
219
-
220
-
221
-
222
-
223
-
224
 |
 |
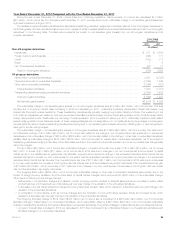
Our DAC and VOBA balance is also impacted by unrealized investment gains (losses) and the amount of amortization which would have been
recognized if such gains and losses had been realized. The decrease in unrealized investment gains increased the DAC and VOBA balance by $1.3
billion in 2013, while the increase in unrealized investment gains decreased the DAC and VOBA balance by $713 million and $788 million in 2012 and
2011, respectively. See Notes 5 and 8 of the Notes to the Consolidated Financial Statements for information regarding the DAC and VOBA offset to
unrealized investment losses.
Estimated Fair Value of Investments
In determining the estimated fair value of our investments, we maximize the use of quoted prices in active markets. When quoted prices in active
markets are not available, various methodologies, assumptions and inputs are utilized, giving priority to observable inputs. When observable inputs are
not available, unobservable inputs or inputs that cannot be derived principally from or corroborated by observable market data are used which can be
based in large part on management judgment or estimation, and cannot be supported by reference to market activity. Accordingly, the estimated fair
values are based on available market information and management’s judgments about financial instruments. The methodologies, assumptions and
inputs utilized are described in Note 10 of the Notes to the Consolidated Financial Statements.
Financial markets are susceptible to severe events evidenced by rapid depreciation in asset values accompanied by a reduction in asset liquidity.
Our ability to sell securities, or the price ultimately realized for these securities, depends upon the demand and liquidity in the market and increases the
use of judgment in determining the estimated fair value of certain securities.
Investment Impairments
One of the significant estimates related to available-for-sale (“AFS”) securities is our impairment evaluation. The assessment of whether an other-
than-temporary impairment (“OTTI”) occurred is based on our case-by-case evaluation of the underlying reasons for the decline in estimated fair value on
a security-by-security basis. Our review of each fixed maturity and equity security for OTTI includes an analysis of gross unrealized losses by three
categories of severity and/or age of gross unrealized loss. An extended and severe unrealized loss position on a fixed maturity security may not have
any impact on the ability of the issuer to service all scheduled interest and principal payments. Accordingly, such an unrealized loss position may not
impact our evaluation of recoverability of all contractual cash flows or the ability to recover an amount at least equal to its amortized cost based on the
present value of the expected future cash flows to be collected. In contrast, for certain equity securities, greater weight and consideration are given to a
decline in estimated fair value and the likelihood such estimated fair value decline will recover.
Additionally, we consider a wide range of factors about the security issuer and use our best judgment in evaluating the cause of the decline in the
estimated fair value of the security and in assessing the prospects for near-term recovery. Inherent in our evaluation of the security are assumptions and
estimates about the operations of the issuer and its future earnings potential. Factors we consider in the OTTI evaluation process are described in Note
8 of the Notes to the Consolidated Financial Statements.
The determination of the amount of allowances and impairments on the remaining invested asset classes is highly subjective and is based upon our
periodic evaluation and assessment of known and inherent risks associated with the respective asset class. Such evaluations and assessments are
revised as conditions change and new information becomes available.
See Notes 1 and 8 of the Notes to the Consolidated Financial Statements for additional information relating to our determination of the amount of
allowances and impairments.
Derivatives
The determination of estimated fair value of freestanding derivatives, when quoted market values are not available, is based on market standard
valuation methodologies and inputs that management believes are consistent with what other market participants would use when pricing the
instruments. Derivative valuations can be affected by changes in interest rates, foreign currency exchange rates, financial indices, credit spreads, default
risk, nonperformance risk, volatility, liquidity and changes in estimates and assumptions used in the pricing models. See Note 10 of the Notes to the
Consolidated Financial Statements for additional details on significant inputs into the over-the-counter (“OTC”) derivative pricing models and credit risk
adjustment.
We issue variable annuity products with guaranteed minimum benefits, some of which are embedded derivatives measured at estimated fair value
separately from the host variable annuity product, with changes in estimated fair value reported in net derivative gains (losses). The estimated fair values
of these embedded derivatives are determined based on the present value of projected future benefits minus the present value of projected future fees.
The projections of future benefits and future fees require capital market and actuarial assumptions, including expectations concerning policyholder
behavior. A risk neutral valuation methodology is used under which the cash flows from the guarantees are projected under multiple capital market
scenarios using observable risk free rates. The valuation of these embedded derivatives also includes an adjustment for our nonperformance risk and
risk margins for non-capital market inputs. The nonperformance risk adjustment, which is captured as a spread over the risk free rate in determining the
discount rate to discount the cash flows of the liability, is determined by taking into consideration publicly available information relating to spreads in the
secondary market for MetLife, Inc.’s debt, including related credit default swaps. These observable spreads are then adjusted, as necessary, to reflect
the priority of these liabilities and the claims paying ability of the issuing insurance subsidiaries compared to MetLife, Inc. Risk margins are established to
capture the non-capital market risks of the instrument which represent the additional compensation a market participant would require to assume the
risks related to the uncertainties in certain actuarial assumptions. The establishment of risk margins requires the use of significant management
judgment, including assumptions of the amount and cost of capital needed to cover the guarantees.
The table below illustrates the impact that a range of reasonably likely variances in credit spreads would have on our consolidated balance sheet,
excluding the effect of income tax, related to the embedded derivative valuation on certain variable annuity products measured at estimated fair value.
However, these estimated effects do not take into account potential changes in other variables, such as equity price levels and market volatility, which
can also contribute significantly to changes in carrying values. Therefore, the table does not necessarily reflect the ultimate impact on the consolidated
financial statement under the credit spread variance scenarios presented below.
16 MetLife, Inc.