MetLife 2013 Annual Report Download - page 132
Download and view the complete annual report
Please find page 132 of the 2013 MetLife annual report below. You can navigate through the pages in the report by either clicking on the pages listed below, or by using the keyword search tool below to find specific information within the annual report.-
 1
1 -
2
-
3
-
4
-
5
-
6
-
7
-
8
-
9
-
10
-
11
-
12
-
13
-
14
-
15
-
16
-
17
-
18
-
19
-
20
-
21
-
22
-
23
-
24
-
25
-
26
-
27
-
28
-
29
-
30
-
31
-
32
-
33
-
34
-
35
-
36
-
37
-
38
-
39
-
40
-
41
-
42
-
43
-
44
-
45
-
46
-
47
-
48
-
49
-
50
-
51
-
52
-
53
-
54
-
55
-
56
-
57
-
58
-
59
-
60
-
61
-
62
-
63
-
64
-
65
-
66
-
67
-
68
-
69
-
70
-
71
-
72
-
73
-
74
-
75
-
76
-
77
-
78
-
79
-
80
-
81
-
82
-
83
-
84
-
85
-
86
-
87
-
88
-
89
-
90
-
91
-
92
-
93
-
94
-
95
-
96
-
97
-
98
-
99
-
100
-
101
-
102
-
103
-
104
-
105
-
106
-
107
-
108
-
109
-
110
-
111
-
112
-
113
-
114
-
115
-
116
-
117
-
118
-
119
-
120
-
121
-
 122
122 -
 123
123 -
 124
124 -
 125
125 -
 126
126 -
 127
127 -
 128
128 -
 129
129 -
 130
130 -
 131
131 -
 132
132 -
 133
133 -
 134
134 -
 135
135 -
 136
136 -
 137
137 -
 138
138 -
 139
139 -
 140
140 -
 141
141 -
 142
142 -
143
-
144
-
145
-
146
-
147
-
148
-
149
-
150
-
151
-
152
-
153
-
154
-
155
-
156
-
157
-
158
-
159
-
160
-
161
-
162
-
163
-
164
-
165
-
166
-
167
-
168
-
169
-
170
-
171
-
172
-
173
-
174
-
175
-
176
-
177
-
178
-
179
-
180
-
181
-
182
-
183
-
184
-
185
-
186
-
187
-
188
-
189
-
190
-
191
-
192
-
193
-
194
-
195
-
196
-
197
-
198
-
199
-
200
-
201
-
202
-
203
-
204
-
205
-
206
-
207
-
208
-
209
-
210
-
211
-
212
-
213
-
214
-
215
-
216
-
217
-
218
-
219
-
220
-
221
-
222
-
223
-
224
 |
 |

MetLife, Inc.
Notes to the Consolidated Financial Statements — (Continued)
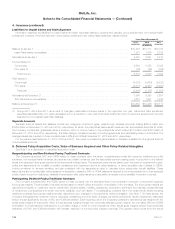
8. Investments (continued)
process include, but are not limited to: (i) the length of time and the extent to which the estimated fair value has been below cost or amortized cost;
(ii) the potential for impairments when the issuer is experiencing significant financial difficulties; (iii) the potential for impairments in an entire industry
sector or sub-sector; (iv) the potential for impairments in certain economically depressed geographic locations; (v) the potential for impairments where
the issuer, series of issuers or industry has suffered a catastrophic loss or has exhausted natural resources; (vi) with respect to fixed maturity
securities, whether the Company has the intent to sell or will more likely than not be required to sell a particular security before the decline in
estimated fair value below amortized cost recovers; (vii) with respect to structured securities, changes in forecasted cash flows after considering the
quality of underlying collateral, expected prepayment speeds, current and forecasted loss severity, consideration of the payment terms of the
underlying assets backing a particular security, and the payment priority within the tranche structure of the security; and (viii) other subjective factors,
including concentrations and information obtained from regulators and rating agencies.
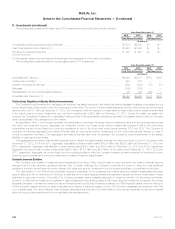
The methodology and significant inputs used to determine the amount of credit loss on fixed maturity securities are as follows:
‰The Company calculates the recovery value by performing a discounted cash flow analysis based on the present value of future cash flows. The
discount rate is generally the effective interest rate of the security prior to impairment.
‰When determining collectability and the period over which value is expected to recover, the Company applies considerations utilized in its overall
impairment evaluation process which incorporates information regarding the specific security, fundamentals of the industry and geographic area in
which the security issuer operates, and overall macroeconomic conditions. Projected future cash flows are estimated using assumptions derived
from management’s best estimates of likely scenario-based outcomes after giving consideration to a variety of variables that include, but are not
limited to: payment terms of the security; the likelihood that the issuer can service the interest and principal payments; the quality and amount of
any credit enhancements; the security’s position within the capital structure of the issuer; possible corporate restructurings or asset sales by the
issuer; and changes to the rating of the security or the issuer by rating agencies.
‰Additional considerations are made when assessing the unique features that apply to certain structured securities including, but not limited to: the
quality of underlying collateral, expected prepayment speeds, current and forecasted loss severity, consideration of the payment terms of the
underlying loans or assets backing a particular security, and the payment priority within the tranche structure of the security.
‰When determining the amount of the credit loss for U.S. and foreign corporate securities, foreign government securities and state and political
subdivision securities, the estimated fair value is considered the recovery value when available information does not indicate that another value is
more appropriate. When information is identified that indicates a recovery value other than estimated fair value, management considers in the
determination of recovery value the same considerations utilized in its overall impairment evaluation process as described above, as well as any
private and public sector programs to restructure such securities.
With respect to securities that have attributes of debt and equity (perpetual hybrid securities), consideration is given in the OTTI analysis as to
whether there has been any deterioration in the credit of the issuer and the likelihood of recovery in value of the securities that are in a severe and
extended unrealized loss position. Consideration is also given as to whether any perpetual hybrid securities, with an unrealized loss, regardless of
credit rating, have deferred any dividend payments. When an OTTI loss has occurred, the OTTI loss is the entire difference between the perpetual
hybrid security’s cost and its estimated fair value with a corresponding charge to earnings.
The cost or amortized cost of fixed maturity and equity securities is adjusted for OTTI in the period in which the determination is made. The
Company does not change the revised cost basis for subsequent recoveries in value.
In periods subsequent to the recognition of OTTI on a fixed maturity security, the Company accounts for the impaired security as if it had been
purchased on the measurement date of the impairment. Accordingly, the discount (or reduced premium) based on the new cost basis is accreted
over the remaining term of the fixed maturity security in a prospective manner based on the amount and timing of estimated future cash flows.
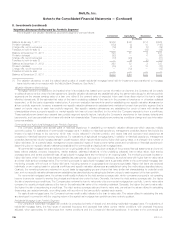
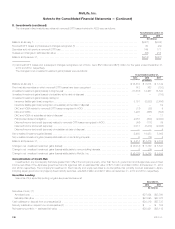
Current Period Evaluation
Based on the Company’s current evaluation of its AFS securities in an unrealized loss position in accordance with its impairment policy, and the
Company’s current intentions and assessments (as applicable to the type of security) about holding, selling and any requirements to sell these
securities, the Company has concluded that these securities are not other-than-temporarily impaired at December 31, 2013. Future OTTI will depend
primarily on economic fundamentals, issuer performance (including changes in the present value of future cash flows expected to be collected), and
changes in credit ratings, collateral valuation, interest rates and credit spreads. If economic fundamentals deteriorate or if there are adverse changes
in the above factors, OTTI may be incurred in upcoming periods.
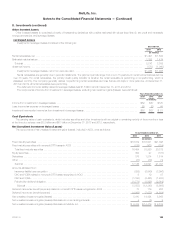
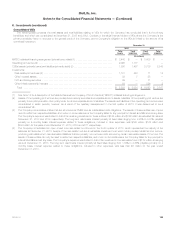
Gross unrealized losses on fixed maturity securities increased $2.9 billion during the year ended December 31, 2013 from $1.7 billion to
$4.6 billion. The increase in gross unrealized losses for the year ended December 31, 2013, was primarily attributable to an increase in interest rates,
partially offset by narrowing credit spreads.
At December 31, 2013, $296 million of the total $4.6 billion of gross unrealized losses were from 95 fixed maturity securities with an unrealized
loss position of 20% or more of amortized cost for six months or greater.
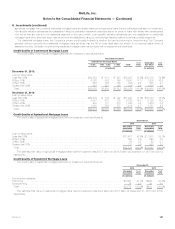
Investment Grade Fixed Maturity Securities
Of the $296 million of gross unrealized losses on fixed maturity securities with an unrealized loss of 20% or more of amortized cost for six months
or greater, $165 million, or 56%, are related to gross unrealized losses on 64 investment grade fixed maturity securities. Unrealized losses on
investment grade fixed maturity securities are principally related to widening credit spreads and, with respect to fixed-rate fixed maturity securities,
rising interest rates since purchase.
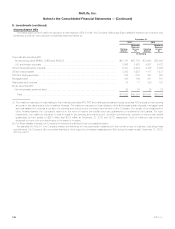
Below Investment Grade Fixed Maturity Securities
Of the $296 million of gross unrealized losses on fixed maturity securities with an unrealized loss of 20% or more of amortized cost for six months
or greater, $131 million, or 44%, are related to gross unrealized losses on 31 below investment grade fixed maturity securities. Unrealized losses on
below investment grade fixed maturity securities are principally related to non-agency RMBS (primarily alternative residential mortgage loans) and ABS
(primarily foreign ABS) and are the result of significantly wider credit spreads resulting from higher risk premiums since purchase, largely due to
economic and market uncertainties including concerns over unemployment levels and valuations of residential real estate supporting non-agency
RMBS. Management evaluates non-agency RMBS and ABS based on actual and projected cash flows after considering the quality of underlying
124 MetLife, Inc.