MetLife 2013 Annual Report Download - page 157
Download and view the complete annual report
Please find page 157 of the 2013 MetLife annual report below. You can navigate through the pages in the report by either clicking on the pages listed below, or by using the keyword search tool below to find specific information within the annual report.-
 1
1 -
2
-
3
-
4
-
5
-
6
-
7
-
8
-
9
-
10
-
11
-
12
-
13
-
14
-
15
-
16
-
17
-
18
-
19
-
20
-
21
-
22
-
23
-
24
-
25
-
26
-
27
-
28
-
29
-
30
-
31
-
32
-
33
-
34
-
35
-
36
-
37
-
38
-
39
-
40
-
41
-
42
-
43
-
44
-
45
-
46
-
47
-
48
-
49
-
50
-
51
-
52
-
53
-
54
-
55
-
56
-
57
-
58
-
59
-
60
-
61
-
62
-
63
-
64
-
65
-
66
-
67
-
68
-
69
-
70
-
71
-
72
-
73
-
74
-
75
-
76
-
77
-
78
-
79
-
80
-
81
-
82
-
83
-
84
-
85
-
86
-
87
-
88
-
89
-
90
-
91
-
92
-
93
-
94
-
95
-
96
-
97
-
98
-
99
-
100
-
101
-
102
-
103
-
104
-
105
-
106
-
107
-
108
-
109
-
110
-
111
-
112
-
113
-
114
-
115
-
116
-
117
-
118
-
119
-
120
-
121
-
122
-
123
-
124
-
125
-
126
-
127
-
128
-
129
-
130
-
131
-
132
-
133
-
134
-
135
-
136
-
137
-
138
-
139
-
140
-
141
-
142
-
143
-
144
-
145
-
146
-
 147
147 -
 148
148 -
 149
149 -
 150
150 -
 151
151 -
 152
152 -
 153
153 -
 154
154 -
 155
155 -
 156
156 -
 157
157 -
 158
158 -
 159
159 -
 160
160 -
 161
161 -
 162
162 -
 163
163 -
 164
164 -
 165
165 -
 166
166 -
 167
167 -
168
-
169
-
170
-
171
-
172
-
173
-
174
-
175
-
176
-
177
-
178
-
179
-
180
-
181
-
182
-
183
-
184
-
185
-
186
-
187
-
188
-
189
-
190
-
191
-
192
-
193
-
194
-
195
-
196
-
197
-
198
-
199
-
200
-
201
-
202
-
203
-
204
-
205
-
206
-
207
-
208
-
209
-
210
-
211
-
212
-
213
-
214
-
215
-
216
-
217
-
218
-
219
-
220
-
221
-
222
-
223
-
224
 |
 |

MetLife, Inc.
Notes to the Consolidated Financial Statements — (Continued)
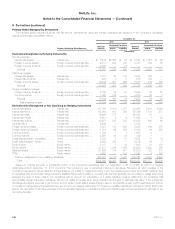
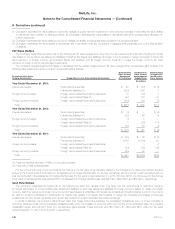
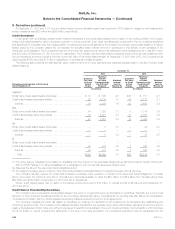
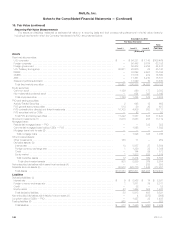
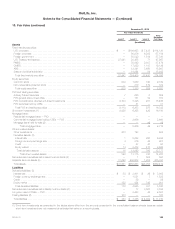
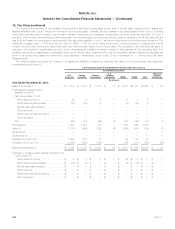
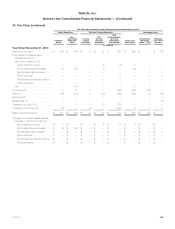
10. Fair Value (continued)
December 31, 2012
Fair Value Hierarchy
Level 1 Level 2 Level 3
Total
Estimated
Fair Value
(In millions)
Assets
Fixed maturity securities:
U.S. corporate .................................................................... $ — $106,693 $ 7,433 $114,126
Foreign corporate ................................................................. — 60,976 6,208 67,184
Foreign government ............................................................... — 55,522 1,814 57,336
U.S. Treasury and agency ........................................................... 27,441 20,455 71 47,967
RMBS .......................................................................... — 35,442 2,037 37,479
CMBS .......................................................................... — 17,982 1,147 19,129
ABS............................................................................ — 12,341 3,656 15,997
State and political subdivision ........................................................ — 14,994 54 15,048
Total fixed maturity securities ....................................................... 27,441 324,405 22,420 374,266
Equity securities:
Common stock ................................................................... 932 1,040 190 2,162
Non-redeemable preferred stock ..................................................... — 310 419 729
Total equity securities ............................................................. 932 1,350 609 2,891
FVO and trading securities:
Actively Traded Securities ........................................................... 7 646 6 659
FVO general account securities ...................................................... — 151 32 183
FVO contractholder-directed unit-linked investments ...................................... 9,103 5,425 937 15,465
FVO securities held by CSEs ........................................................ — 41 — 41
Total FVO and trading securities ..................................................... 9,110 6,263 975 16,348
Short-term investments (1) ........................................................... 9,426 6,295 429 16,150
Mortgage loans:
Residential mortgage loans — FVO ................................................... — — — —
Commercial mortgage loans held by CSEs — FVO ....................................... — 2,666 — 2,666
Mortgage loans held-for-sale (2) ...................................................... — — 49 49
Total mortgage loans .......................................................... — 2,666 49 2,715
Other invested assets:
Other investments ................................................................. 303 123 — 426
Derivative assets: (3)
Interest rate ..................................................................... 1 9,648 206 9,855
Foreign currency exchange rate ..................................................... 4 819 44 867
Credit ......................................................................... — 47 43 90
Equity market ................................................................... 14 2,478 473 2,965
Total derivative assets ........................................................... 19 12,992 766 13,777
Total other invested assets ..................................................... 322 13,115 766 14,203
Net embedded derivatives within asset host contracts (4) ................................... — 1 505 506
Separate account assets (5) .......................................................... 31,620 202,568 1,205 235,393
Total assets ...................................................................... $78,851 $556,663 $26,958 $662,472
Liabilities
Derivative liabilities: (3)
Interest rate ...................................................................... $ 38 $ 3,001 $ 29 $ 3,068
Foreign currency exchange rate ...................................................... — 1,521 7 1,528
Credit .......................................................................... — 39 — 39
Equity market ..................................................................... 132 424 345 901
Total derivative liabilities ........................................................... 170 4,985 381 5,536
Net embedded derivatives within liability host contracts (4) ................................... — 17 3,667 3,684
Long-term debt of CSEs — FVO ....................................................... — 2,483 44 2,527
Trading liabilities (6) ................................................................. 163 — — 163
Total liabilities ..................................................................... $ 333 $ 7,485 $ 4,092 $ 11,910
(1) Short-term investments as presented in the tables above differ from the amounts presented in the consolidated balance sheets because certain
short-term investments are not measured at estimated fair value on a recurring basis.
MetLife, Inc. 149