MetLife 2013 Annual Report Download - page 40
Download and view the complete annual report
Please find page 40 of the 2013 MetLife annual report below. You can navigate through the pages in the report by either clicking on the pages listed below, or by using the keyword search tool below to find specific information within the annual report.-
 1
1 -
2
-
3
-
4
-
5
-
6
-
7
-
8
-
9
-
10
-
11
-
12
-
13
-
14
-
15
-
16
-
17
-
18
-
19
-
20
-
21
-
22
-
23
-
24
-
25
-
26
-
27
-
28
-
29
-
 30
30 -
 31
31 -
 32
32 -
 33
33 -
 34
34 -
 35
35 -
 36
36 -
 37
37 -
 38
38 -
 39
39 -
 40
40 -
 41
41 -
 42
42 -
 43
43 -
 44
44 -
 45
45 -
 46
46 -
 47
47 -
 48
48 -
 49
49 -
 50
50 -
51
-
52
-
53
-
54
-
55
-
56
-
57
-
58
-
59
-
60
-
61
-
62
-
63
-
64
-
65
-
66
-
67
-
68
-
69
-
70
-
71
-
72
-
73
-
74
-
75
-
76
-
77
-
78
-
79
-
80
-
81
-
82
-
83
-
84
-
85
-
86
-
87
-
88
-
89
-
90
-
91
-
92
-
93
-
94
-
95
-
96
-
97
-
98
-
99
-
100
-
101
-
102
-
103
-
104
-
105
-
106
-
107
-
108
-
109
-
110
-
111
-
112
-
113
-
114
-
115
-
116
-
117
-
118
-
119
-
120
-
121
-
122
-
123
-
124
-
125
-
126
-
127
-
128
-
129
-
130
-
131
-
132
-
133
-
134
-
135
-
136
-
137
-
138
-
139
-
140
-
141
-
142
-
143
-
144
-
145
-
146
-
147
-
148
-
149
-
150
-
151
-
152
-
153
-
154
-
155
-
156
-
157
-
158
-
159
-
160
-
161
-
162
-
163
-
164
-
165
-
166
-
167
-
168
-
169
-
170
-
171
-
172
-
173
-
174
-
175
-
176
-
177
-
178
-
179
-
180
-
181
-
182
-
183
-
184
-
185
-
186
-
187
-
188
-
189
-
190
-
191
-
192
-
193
-
194
-
195
-
196
-
197
-
198
-
199
-
200
-
201
-
202
-
203
-
204
-
205
-
206
-
207
-
208
-
209
-
210
-
211
-
212
-
213
-
214
-
215
-
216
-
217
-
218
-
219
-
220
-
221
-
222
-
223
-
224
 |
 |

Year Ended December 31, 2012 Compared with the Year Ended December 31, 2011
Unless otherwise stated, all amounts discussed below are net of income tax.
Most of our businesses continued to experience growth in 2012, as the economy has continued to slowly improve. Our group term life and
disability businesses grew as a result of new sales, and our dental business continued to benefit from strong enrollments and renewals, as well as
premiums associated with the implementation of a new dental contract from a large customer that began in the second quarter of 2012. Although we
have discontinued selling our LTC product, we continue to collect premiums and administer the existing block of business, contributing to asset
growth in the segment. Although policy sales for both auto and homeowners decreased as compared to 2011, the impact of an increase in the
average premium for new policies sold more than offset the decline in policy sales.
Lower severity of property & casualty catastrophe claims in 2012 increased operating earnings by $31 million, mainly as a result of severe storm
activity in the second and third quarters of 2011, which were greater than the impact of severe storm activity in the fourth quarter of 2012, primarily
the result of Superstorm Sandy. While property & casualty non-catastrophe claims experience was relatively flat year over year, an increase in severity
of $24 million, was largely offset by lower claims frequency of $20 million. A decrease in claims in our dental, disability and accidental death and
dismemberment businesses resulted in a $28 million increase to operating earnings. Lower utilization in our dental business, as well as lower
incidence and approvals in our disability business drove this improvement in operating earnings. A decrease in operating earnings of $72 million
resulted from less favorable mortality experience in our life businesses, mainly due to very strong mortality experience in 2011, which was partially
offset by the favorable net impact of reserve refinements of $30 million that occurred in both years. The mortality ratio for our life businesses has
returned to a more historically representative level of 87.9% in 2012, as adjusted for the aforementioned favorable reserve refinements, from a near
record low of 86.1% in the 2011, as adjusted for a 2011 charge related to our use of the U.S. Social Security Administration’s Death Master File. In
our life businesses, the impact of the aforementioned 2011 charge contributed $81 million to the increase in operating earnings. The impact of the
items discussed above related to the property & casualty business can be seen in the favorable change in the combined ratio, including
catastrophes, to 96.5% in 2012 from 101.9% in 2011, as well as the favorable change in the combined ratio, excluding catastrophes, to 88.7% in
2012 from 90.2% in 2011.
Premiums and deposits in 2012, together with growth in the securities lending program, partially offset by a reduction in allocated equity, have
resulted in an increase in our average invested assets, contributing $10 million to operating earnings. Consistent with the growth in average invested
assets from 2012 premiums and deposits, primarily in our LTC business, interest credited on long-duration contracts and PABs increased by
$15 million. Our 2012 results include a $50 million impairment charge on an intangible asset, related to a previously acquired dental business, as well
as increased expenses associated with the implementation of the new dental contract in the second quarter of 2012, partially offset by lower
marketing and sales-related expenses in our LTC business. An increase in the average premium per policy in both our auto and homeowners
businesses, as well as an increase in exposures, improved operating earnings by $34 million.
The impact of the low interest rate environment combined with lower returns in the real estate and alternative investment markets resulted in a
decline in investment yields on our fixed maturity securities, securities lending program, real estate joint ventures and alternative investments. Unlike in
the Retail and Corporate Benefit Funding segments, a change in investment yield does not necessarily drive a corresponding change in the rates
credited on certain insurance liabilities. The reduction in investment yield was partially offset by marginally lower crediting rates in 2012, and resulted in
a $3 million decrease in operating earnings.
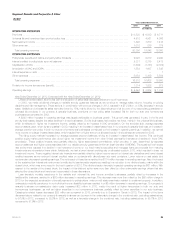
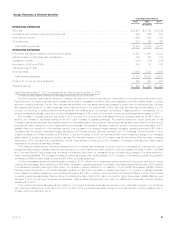
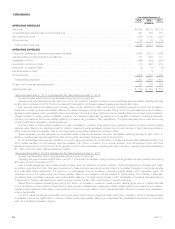
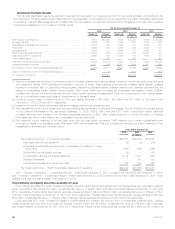
Corporate Benefit Funding
Years Ended December 31,
2013 2012 2011
(In millions)
OPERATING REVENUES
Premiums ....................................................................................... $2,859 $3,237 $2,848
Universal life and investment-type product policy fees ..................................................... 247 225 232
Net investment income ............................................................................. 5,790 5,703 5,506
Other revenues ................................................................................... 278 259 249
Total operating revenues .......................................................................... 9,174 9,424 8,835
OPERATING EXPENSES
Policyholder benefits and claims and policyholder dividends ................................................ 5,402 5,704 5,287
Interest credited to policyholder account balances ........................................................ 1,233 1,358 1,323
Capitalization of DAC .............................................................................. (27) (29) (25)
Amortization of DAC and VOBA ...................................................................... 23 22 17
Interest expense on debt ........................................................................... 9 8 9
Other expenses .................................................................................. 523 478 513
Total operating expenses ......................................................................... 7,163 7,541 7,124
Provision for income tax expense (benefit) .............................................................. 704 659 599
Operating earnings ................................................................................ $1,307 $1,224 $1,112
Year Ended December 31, 2013 Compared with the Year Ended December 31, 2012
Unless otherwise stated, all amounts discussed below are net of income tax.
The sustained low interest rate environment has contributed to pension plans being underfunded, which limits our customers’ ability to engage in
full pension plan closeout terminations. During 2012, the conversion of an existing contract involving the transfer of funds from the separate account
to the general account resulted in a significant increase in premiums in our domestic closeout business. Excluding the impact of this conversion,
closeout premiums increased $534 million, before income tax, reflecting growth in our domestic business that was tempered by decreased sales in
32 MetLife, Inc.