MetLife 2013 Annual Report Download - page 49
Download and view the complete annual report
Please find page 49 of the 2013 MetLife annual report below. You can navigate through the pages in the report by either clicking on the pages listed below, or by using the keyword search tool below to find specific information within the annual report.-
 1
1 -
2
-
3
-
4
-
5
-
6
-
7
-
8
-
9
-
10
-
11
-
12
-
13
-
14
-
15
-
16
-
17
-
18
-
19
-
20
-
21
-
22
-
23
-
24
-
25
-
26
-
27
-
28
-
29
-
30
-
31
-
32
-
33
-
34
-
35
-
36
-
37
-
38
-
 39
39 -
 40
40 -
 41
41 -
 42
42 -
 43
43 -
 44
44 -
 45
45 -
 46
46 -
 47
47 -
 48
48 -
 49
49 -
 50
50 -
 51
51 -
 52
52 -
 53
53 -
 54
54 -
 55
55 -
 56
56 -
 57
57 -
 58
58 -
 59
59 -
60
-
61
-
62
-
63
-
64
-
65
-
66
-
67
-
68
-
69
-
70
-
71
-
72
-
73
-
74
-
75
-
76
-
77
-
78
-
79
-
80
-
81
-
82
-
83
-
84
-
85
-
86
-
87
-
88
-
89
-
90
-
91
-
92
-
93
-
94
-
95
-
96
-
97
-
98
-
99
-
100
-
101
-
102
-
103
-
104
-
105
-
106
-
107
-
108
-
109
-
110
-
111
-
112
-
113
-
114
-
115
-
116
-
117
-
118
-
119
-
120
-
121
-
122
-
123
-
124
-
125
-
126
-
127
-
128
-
129
-
130
-
131
-
132
-
133
-
134
-
135
-
136
-
137
-
138
-
139
-
140
-
141
-
142
-
143
-
144
-
145
-
146
-
147
-
148
-
149
-
150
-
151
-
152
-
153
-
154
-
155
-
156
-
157
-
158
-
159
-
160
-
161
-
162
-
163
-
164
-
165
-
166
-
167
-
168
-
169
-
170
-
171
-
172
-
173
-
174
-
175
-
176
-
177
-
178
-
179
-
180
-
181
-
182
-
183
-
184
-
185
-
186
-
187
-
188
-
189
-
190
-
191
-
192
-
193
-
194
-
195
-
196
-
197
-
198
-
199
-
200
-
201
-
202
-
203
-
204
-
205
-
206
-
207
-
208
-
209
-
210
-
211
-
212
-
213
-
214
-
215
-
216
-
217
-
218
-
219
-
220
-
221
-
222
-
223
-
224
 |
 |

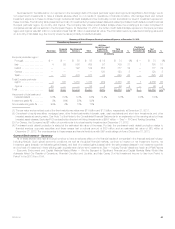
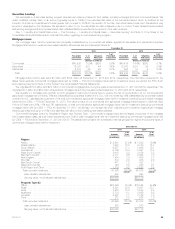
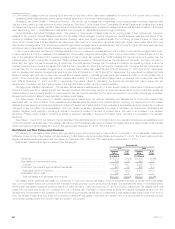
As presented in the table below, our exposure to the sovereign debt of Europe’s perimeter region and Cyprus is insignificant. Accordingly, we do
not expect such investments to have a material adverse effect on our results of operations or financial condition. We manage direct and indirect
investment exposure in these countries through fundamental credit analysis and we continually monitor and adjust our level of investment exposure in
these countries. The following table presents a summary of investments by invested asset class and related purchased credit default protection across
Europe’s perimeter region, by country, and Cyprus. The Company has written credit default swaps where the underlying is an index comprised of
companies across various sectors in the European Region. At December 31, 2013, the written credit default swaps exposure to Europe’s perimeter
region and Cyprus was $21 million in notional and less than $1 million in estimated fair value. The information below is presented at carrying value and
on a country of risk basis (e.g. the country where the issuer primarily conducts business).
Summary of Select European Country Investment Exposure at December 31, 2013
Fixed Maturity Securities (1)
Sovereign Financial
Services Non-Financial
Services Total
All Other
General Account
Investment
Exposure (2) Total
Exposure (3) %
Purchased
Credit Default
Protection (4) Net
Exposure %
(In millions)
Europe’s perimeter region:
Portugal ................ $ — $ — $ 55 $ 55 $ 19 $ 74 3% $ — $ 74 3%
Italy ................... 4 92 566 662 97 759 31 1 760 31
Ireland ................. — — 122 122 655 777 32 — 777 32
Greece ................ — — — — 120 120 5 — 120 5
Spain .................. — 101 476 577 48 625 25 — 625 25
Total Europe’s perimeter
region ................. 4 193 1,219 1,416 939 2,355 96 1 2,356 96
Cyprus ................ 85 — — 85 4 89 4 — 89 4
Total .................... $89 $193 $1,219 $1,501 $943 $2,444 100% $ 1 $2,445 100%
As percent of total cash and
invested assets .......... 0.0% 0.0% 0.3% 0.3% 0.2% 0.5% 0.0% 0.5%
Investment grade % ........ 5% 94% 87% 83%
Non-investment grade % .... 95% 6% 13% 17%
(1) The par value and amortized cost of the fixed maturity securities were $1.4 billion and $1.5 billion, respectively, at December 31, 2013.
(2) Comprised of equity securities, mortgage loans, other limited partnership interests, cash, cash equivalents and short-term investments, and other
invested assets at carrying value. See Note 1 of the Notes to the Consolidated Financial Statements for an explanation of the carrying value for these
invested asset classes. Excludes FVO contractholder-directed unit-linked investments of $957 million — See “— FVO and Trading Securities.”
(3) For Greece, the Company had $1 million of commitments to fund partnership investments at December 31, 2013.
(4) Purchased credit default protection is stated at the estimated fair value of the swap. For Italy, the purchased credit default protection relates to
financial services corporate securities and these swaps had a notional amount of $80 million and an estimated fair value of ($1) million at
December 31, 2013. The counterparties to these swaps are financial institutions with S&P credit ratings of A as of December 31, 2013.
Current Environment - Summary
All of these factors have had and could continue to have an adverse effect on the financial results of companies in the financial services industry,
including MetLife. Such global economic conditions, as well as the global financial markets, continue to impact our net investment income, net
investment gains (losses), net derivative gains (losses), and level of unrealized gains (losses) within the various asset classes in our investment portfolio
and our level of investment in lower yielding cash equivalents and short-term investments. See “— Industry Trends” elsewhere herein and “Risk Factors
— Economic Environment and Capital Markets-Related Risks — We Are Exposed to Significant Financial and Capital Markets Risks Which May
Adversely Affect Our Results of Operations, Financial Condition and Liquidity, and May Cause Our Net Investment Income to Vary from Period to
Period” in the 2013 Form 10-K.
MetLife, Inc. 41