MetLife 2013 Annual Report Download - page 164
Download and view the complete annual report
Please find page 164 of the 2013 MetLife annual report below. You can navigate through the pages in the report by either clicking on the pages listed below, or by using the keyword search tool below to find specific information within the annual report.-
 1
1 -
2
-
3
-
4
-
5
-
6
-
7
-
8
-
9
-
10
-
11
-
12
-
13
-
14
-
15
-
16
-
17
-
18
-
19
-
20
-
21
-
22
-
23
-
24
-
25
-
26
-
27
-
28
-
29
-
30
-
31
-
32
-
33
-
34
-
35
-
36
-
37
-
38
-
39
-
40
-
41
-
42
-
43
-
44
-
45
-
46
-
47
-
48
-
49
-
50
-
51
-
52
-
53
-
54
-
55
-
56
-
57
-
58
-
59
-
60
-
61
-
62
-
63
-
64
-
65
-
66
-
67
-
68
-
69
-
70
-
71
-
72
-
73
-
74
-
75
-
76
-
77
-
78
-
79
-
80
-
81
-
82
-
83
-
84
-
85
-
86
-
87
-
88
-
89
-
90
-
91
-
92
-
93
-
94
-
95
-
96
-
97
-
98
-
99
-
100
-
101
-
102
-
103
-
104
-
105
-
106
-
107
-
108
-
109
-
110
-
111
-
112
-
113
-
114
-
115
-
116
-
117
-
118
-
119
-
120
-
121
-
122
-
123
-
124
-
125
-
126
-
127
-
128
-
129
-
130
-
131
-
132
-
133
-
134
-
135
-
136
-
137
-
138
-
139
-
140
-
141
-
142
-
143
-
144
-
145
-
146
-
147
-
148
-
149
-
150
-
151
-
152
-
153
-
 154
154 -
 155
155 -
 156
156 -
 157
157 -
 158
158 -
 159
159 -
 160
160 -
 161
161 -
 162
162 -
 163
163 -
 164
164 -
 165
165 -
 166
166 -
 167
167 -
 168
168 -
 169
169 -
 170
170 -
 171
171 -
 172
172 -
 173
173 -
 174
174 -
175
-
176
-
177
-
178
-
179
-
180
-
181
-
182
-
183
-
184
-
185
-
186
-
187
-
188
-
189
-
190
-
191
-
192
-
193
-
194
-
195
-
196
-
197
-
198
-
199
-
200
-
201
-
202
-
203
-
204
-
205
-
206
-
207
-
208
-
209
-
210
-
211
-
212
-
213
-
214
-
215
-
216
-
217
-
218
-
219
-
220
-
221
-
222
-
223
-
224
 |
 |

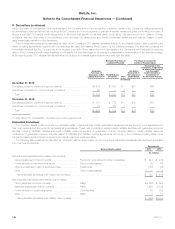
MetLife, Inc.
Notes to the Consolidated Financial Statements — (Continued)
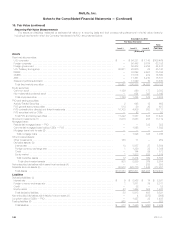
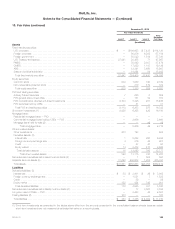
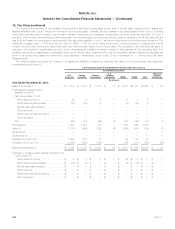
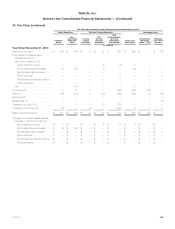
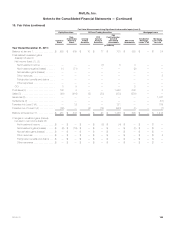
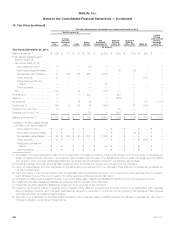
10. Fair Value (continued)
Assets and Liabilities Measured at Fair Value Using Significant Unobservable Inputs (Level 3)
The following table presents certain quantitative information about the significant unobservable inputs used in the fair value measurement, and the
sensitivity of the estimated fair value to changes in those inputs, for the more significant asset and liability classes measured at fair value on a recurring
basis using significant unobservable inputs (Level 3) at:
December 31, 2013 December 31, 2012 Impact of
Increase in Input
on Estimated
Fair Value (2)Valuation Techniques Significant Unobservable Inputs Range Weighted
Average (1) Range Weighted
Average (1)
Fixed maturity
securities: (3)
U.S. corporate and
foreign corporate • Matrix pricing • Delta spread adjustments (4) (10) — 240 46 (50) — 500 90 Decrease
• Illiquidity premium (4) 30 — 30 30 30 — 30 30 Decrease
• Credit spreads (4) (1,489) — 876 174 (1,416) — 876 272 Decrease
• Offered quotes (5) 4 — 145 100 — — 348 115 Increase
• Consensus pricing • Offered quotes (5) 33 — 145 95 — — 555 92 Increase
Foreign government • Matrix pricing • Credit spreads (4) 4 — 72 32 (58) — 150 72 Decrease
• Market pricing • Quoted prices (5) 64 — 156 100 77 — 146 99 Increase
• Consensus pricing • Offered quotes (5) 84 — 156 107 82 — 200 117 Increase
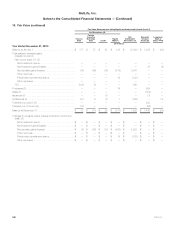
RMBS • Matrix pricing and
discounted cash
flow • Credit spreads (4) (136) — 3,609 288 9 — 2,980 521 Decrease (6)
• Market pricing • Quoted prices (5) 10 — 109 98 13 — 109 100 Increase (6)
• Consensus pricing • Offered quotes (5) 69 — 101 93 28 — 100 75 Increase (6)
CMBS • Matrix pricing and
discounted cash
flow • Credit spreads (4) 215 — 2,025 409 1 — 9,164 374 Decrease (6)
• Market pricing • Quoted prices (5) 70 — 104 97 1 — 106 99 Increase (6)
• Consensus pricing • Offered quotes (5) 90 — 101 95 Increase (6)
ABS • Matrix pricing and
discounted cash
flow • Credit spreads (4) 30 — 1,878 145 — — 1,829 109 Decrease (6)
• Market pricing • Quoted prices (5) — — 110 101 40 — 105 100 Increase (6)
• Consensus pricing • Offered quotes (5) 56 — 106 98 — — 111 97 Increase (6)
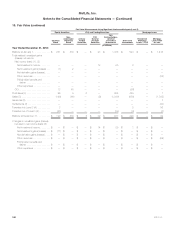
Derivatives:
Interest rate • Present value
techniques • Swap yield (7) 248 — 450 186 — 353 Increase (12)
Foreign currency
exchange rate • Present value
techniques
• Swap yield (7) 97 — 767 228 — 795
• Correlation (8) 38% — 47% 43% — 57% Increase (12)
Credit • Present value
techniques • Credit spreads (9) 98 — 101 100 — 100 Decrease (9)
• Consensus pricing • Offered quotes (10)
Equity market • Present value
techniques or
option pricing
models
• Volatility (11) 13% — 28% 13% — 32% Increase (12)
• Correlation (8) 60% — 60% 65% — 65%
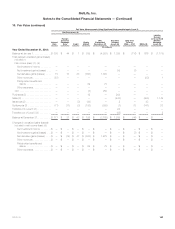
Embedded
derivatives:
Direct and assumed
guaranteed
minimum benefits • Option pricing
techniques
• Mortality rates:
Ages 0 - 40 0% — 0.14% 0% — 0.14% Decrease (13)
Ages 41 - 60 0.04% — 0.88% 0.05% — 0.88% Decrease (13)
Ages 61 - 115 0.26% — 100% 0.26% — 100% Decrease (13)
• Lapse rates:
Durations 1 - 10 0.50% — 100% 0.50% — 100% Decrease (14)
Durations 11 - 20 2% — 100% 2% — 100% Decrease (14)
Durations 21 - 116 2% — 100% 2% — 100% Decrease (14)
• Utilization rates 20% — 50% 20% — 50% Increase (15)
• Withdrawal rates 0% — 40% 0.07% — 20% (16)
• Long-term equity volatilities 9.14% — 40% 15.18% — 40% Increase (17)
• Nonperformance risk spread (1.08)% — 0.83% 0.10% — 1.72% Decrease (18)
156 MetLife, Inc.