MetLife 2013 Annual Report Download - page 44
Download and view the complete annual report
Please find page 44 of the 2013 MetLife annual report below. You can navigate through the pages in the report by either clicking on the pages listed below, or by using the keyword search tool below to find specific information within the annual report.-
 1
1 -
2
-
3
-
4
-
5
-
6
-
7
-
8
-
9
-
10
-
11
-
12
-
13
-
14
-
15
-
16
-
17
-
18
-
19
-
20
-
21
-
22
-
23
-
24
-
25
-
26
-
27
-
28
-
29
-
30
-
31
-
32
-
33
-
 34
34 -
 35
35 -
 36
36 -
 37
37 -
 38
38 -
 39
39 -
 40
40 -
 41
41 -
 42
42 -
 43
43 -
 44
44 -
 45
45 -
 46
46 -
 47
47 -
 48
48 -
 49
49 -
 50
50 -
 51
51 -
 52
52 -
 53
53 -
 54
54 -
55
-
56
-
57
-
58
-
59
-
60
-
61
-
62
-
63
-
64
-
65
-
66
-
67
-
68
-
69
-
70
-
71
-
72
-
73
-
74
-
75
-
76
-
77
-
78
-
79
-
80
-
81
-
82
-
83
-
84
-
85
-
86
-
87
-
88
-
89
-
90
-
91
-
92
-
93
-
94
-
95
-
96
-
97
-
98
-
99
-
100
-
101
-
102
-
103
-
104
-
105
-
106
-
107
-
108
-
109
-
110
-
111
-
112
-
113
-
114
-
115
-
116
-
117
-
118
-
119
-
120
-
121
-
122
-
123
-
124
-
125
-
126
-
127
-
128
-
129
-
130
-
131
-
132
-
133
-
134
-
135
-
136
-
137
-
138
-
139
-
140
-
141
-
142
-
143
-
144
-
145
-
146
-
147
-
148
-
149
-
150
-
151
-
152
-
153
-
154
-
155
-
156
-
157
-
158
-
159
-
160
-
161
-
162
-
163
-
164
-
165
-
166
-
167
-
168
-
169
-
170
-
171
-
172
-
173
-
174
-
175
-
176
-
177
-
178
-
179
-
180
-
181
-
182
-
183
-
184
-
185
-
186
-
187
-
188
-
189
-
190
-
191
-
192
-
193
-
194
-
195
-
196
-
197
-
198
-
199
-
200
-
201
-
202
-
203
-
204
-
205
-
206
-
207
-
208
-
209
-
210
-
211
-
212
-
213
-
214
-
215
-
216
-
217
-
218
-
219
-
220
-
221
-
222
-
223
-
224
 |
 |

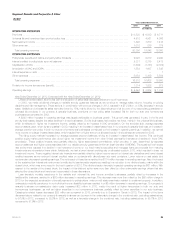
The repositioning of the Japan investment portfolio to longer duration and higher yielding investments in addition to improved results on our private
equity investments, contributed to an increase in investment yields. In addition, yields improved as a result of growth in the Australian and U.S. dollar
annuity businesses, reflecting a higher yielding and more diversified portfolio of Australian and U.S. dollar investments. These improvements in
investment yields increased operating earnings by $132 million.
On an annual basis, we review and update our long-term assumptions used in our calculation of certain insurance-related liabilities and DAC,
which resulted in a $51 million net decrease to operating earnings. This adjustment was primarily related to changes in Japan that assumed the
continuation of the current lower interest rates and reflected the trend of lower long-term lapses resulting in a decrease in operating earnings of
$44 million. In addition, in Korea more policyholders chose to annuitize rather than receive a lump sum payment at maturity; this trend, combined with
changes in future expected persistency, expenses and lapses, resulted in a decrease in operating earnings of $9 million in Korea.
Unfavorable claims experience in 2012 decreased operating earnings by $38 million. Japan’s 2011 results included $39 million of insurance
claims and operating expenses related to the March 2011 earthquake and tsunami. In addition, a 2011 tax benefit in Korea and Australia, combined
with a 2012 tax expense related to net operating loss carryforwards in Hong Kong, resulted in a $21 million net decrease in operating earnings.
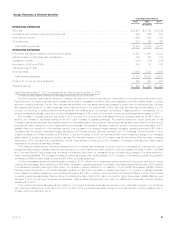
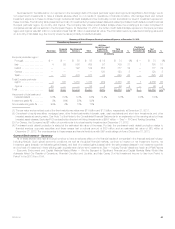
EMEA
Years Ended December 31,
2013 2012 2011
(In millions)
OPERATING REVENUES
Premiums ....................................................................................... $2,297 $2,370 $2,477
Universal life and investment-type product policy fees ..................................................... 386 333 315
Net investment income ............................................................................. 498 535 562
Other revenues ................................................................................... 97 121 123
Total operating revenues .......................................................................... 3,278 3,359 3,477
OPERATING EXPENSES
Policyholder benefits and claims and policyholder dividends ................................................ 1,039 1,196 1,290
Interest credited to policyholder account balances ........................................................ 147 126 166
Capitalization of DAC .............................................................................. (714) (723) (669)
Amortization of DAC and VOBA ...................................................................... 683 626 613
Amortization of negative VOBA ....................................................................... (95) (94) (53)
Interest expense on debt ........................................................................... 1 1 —
Other expenses .................................................................................. 1,810 1,810 1,723
Total operating expenses ......................................................................... 2,871 2,942 3,070
Provision for income tax expense (benefit) .............................................................. 78 146 156
Operating earnings ................................................................................ $ 329 $ 271 $ 251
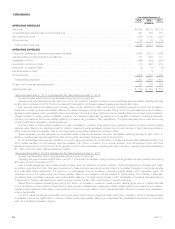
Year Ended December 31, 2013 Compared with the Year Ended December 31, 2012
Unless otherwise stated, all amounts discussed below are net of income tax.
Operating earnings increased by $58 million over 2012. The impact of changes in foreign currency exchange rates increased operating earnings
by $7 million for 2013 as compared to 2012. The third quarter 2012 acquisition of life insurance businesses from the members of the Aviva Plc.
group increased operating earnings by $14 million. This was offset by the disposal of certain blocks of business in the U.K. in the fourth quarter of
2012, which decreased operating earnings by $42 million.
Operating earnings decreased as a result of a $30 million tax charge in 2013 related to the write-off of a U.K. tax loss carryforward. Operating
earnings were negatively impacted by a $26 million write-down of DAC and VOBA related to proposed pension reforms in Poland. In addition, 2012
results benefited by $12 million primarily due to a release of negative VOBA associated with the conversion of certain policies. These items were more
than offset by a $79 million tax benefit following the Company’s decision to permanently reinvest certain foreign earnings. In addition, operating
earnings benefited from adjustments totaling $8 million in Greece for liability refinements in our ordinary and deferred annuity businesses, as wellas
the impact of a change in the local corporate tax rate, both in the first quarter of 2013.
While sales increased compared to 2012, this business growth was somewhat dampened by challenging economic environments in some
European countries. This business growth was driven primarily by Russia, Egypt, Poland and the Persian Gulf, partially offset by management’s
decision to cease fixed annuity sales in the U.K. Operating expenses increased compared to 2012 including the effect of higher corporate
allocations; however, this was offset by expense reduction initiatives primarily in France and Poland. The combined impact of the items discussed
above increased operating earnings by $59 million.
An increase in average invested assets due to growth in Ireland, Russia, Egypt and Poland contributed to an increase in operating earnings of $9
million. Operating earnings decreased by $20 million reflecting lower investment yields on certain alternative asset classes, primarily in Greece,
floating-rate securities, primarily in Ireland and Poland and the impact of a low rate environment on fixed-rate securities, primarily in Greece and
Ukraine.
On an annual basis, we review and update our long-term assumptions used in our calculations of certain insurance-related liabilities and DAC.
The 2013 and 2012 annual updates resulted in a net operating earnings increase of $12 million, primarily related to assumption updates in the
Persian Gulf and Greece.
36 MetLife, Inc.