MetLife 2013 Annual Report Download - page 166
Download and view the complete annual report
Please find page 166 of the 2013 MetLife annual report below. You can navigate through the pages in the report by either clicking on the pages listed below, or by using the keyword search tool below to find specific information within the annual report.-
 1
1 -
2
-
3
-
4
-
5
-
6
-
7
-
8
-
9
-
10
-
11
-
12
-
13
-
14
-
15
-
16
-
17
-
18
-
19
-
20
-
21
-
22
-
23
-
24
-
25
-
26
-
27
-
28
-
29
-
30
-
31
-
32
-
33
-
34
-
35
-
36
-
37
-
38
-
39
-
40
-
41
-
42
-
43
-
44
-
45
-
46
-
47
-
48
-
49
-
50
-
51
-
52
-
53
-
54
-
55
-
56
-
57
-
58
-
59
-
60
-
61
-
62
-
63
-
64
-
65
-
66
-
67
-
68
-
69
-
70
-
71
-
72
-
73
-
74
-
75
-
76
-
77
-
78
-
79
-
80
-
81
-
82
-
83
-
84
-
85
-
86
-
87
-
88
-
89
-
90
-
91
-
92
-
93
-
94
-
95
-
96
-
97
-
98
-
99
-
100
-
101
-
102
-
103
-
104
-
105
-
106
-
107
-
108
-
109
-
110
-
111
-
112
-
113
-
114
-
115
-
116
-
117
-
118
-
119
-
120
-
121
-
122
-
123
-
124
-
125
-
126
-
127
-
128
-
129
-
130
-
131
-
132
-
133
-
134
-
135
-
136
-
137
-
138
-
139
-
140
-
141
-
142
-
143
-
144
-
145
-
146
-
147
-
148
-
149
-
150
-
151
-
152
-
153
-
154
-
155
-
 156
156 -
 157
157 -
 158
158 -
 159
159 -
 160
160 -
 161
161 -
 162
162 -
 163
163 -
 164
164 -
 165
165 -
 166
166 -
 167
167 -
 168
168 -
 169
169 -
 170
170 -
 171
171 -
 172
172 -
 173
173 -
 174
174 -
 175
175 -
 176
176 -
177
-
178
-
179
-
180
-
181
-
182
-
183
-
184
-
185
-
186
-
187
-
188
-
189
-
190
-
191
-
192
-
193
-
194
-
195
-
196
-
197
-
198
-
199
-
200
-
201
-
202
-
203
-
204
-
205
-
206
-
207
-
208
-
209
-
210
-
211
-
212
-
213
-
214
-
215
-
216
-
217
-
218
-
219
-
220
-
221
-
222
-
223
-
224
 |
 |

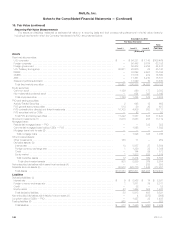
MetLife, Inc.
Notes to the Consolidated Financial Statements — (Continued)
10. Fair Value (continued)
The following is a summary of the valuation techniques and significant unobservable inputs used in the fair value measurement of assets and
liabilities classified within Level 3 that are not included in the preceding table. Generally, all other classes of securities classified within Level 3, including
those within separate account assets, use the same valuation techniques and significant unobservable inputs as previously described for Level 3
securities. This includes matrix pricing and discounted cash flow methodologies, inputs such as quoted prices for identical or similar securities that are
less liquid and based on lower levels of trading activity than securities classified in Level 2, as well as independent non-binding broker quotations. The
residential mortgage loans — FVO and long-term debt of CSEs — FVO are valued using independent non-binding broker quotations and internal
models including matrix pricing and discounted cash flow methodologies using current interest rates. The sensitivity of the estimated fair value to
changes in the significant unobservable inputs for these other assets and liabilities is similar in nature to that described in the preceding table. The
valuation techniques and significant unobservable inputs used in the fair value measurement for the more significant assets measured at estimated fair
value on a nonrecurring basis and determined using significant unobservable inputs (Level 3) are summarized in “— Nonrecurring Fair Value
Measurements.”
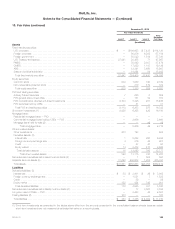
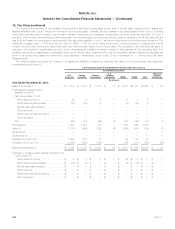
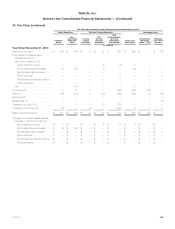
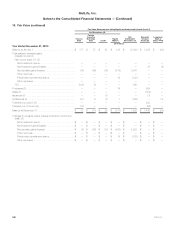
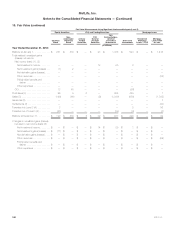
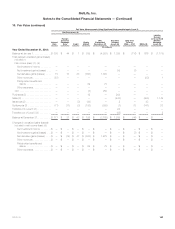
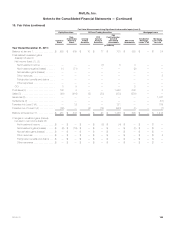
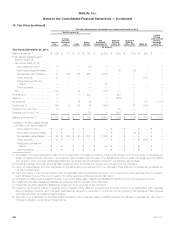
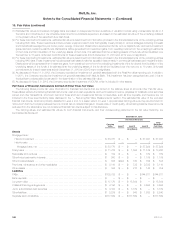
The following tables summarize the change of all assets and (liabilities) measured at estimated fair value on a recurring basis using significant
unobservable inputs (Level 3):
Fair Value Measurements Using Significant Unobservable Inputs (Level 3)
Fixed Maturity Securities:
U.S.
Corporate Foreign
Corporate Foreign
Government
U.S.
Treasury
and Agency RMBS CMBS ABS
State and
Political
Subdivision
(In millions)
Year Ended December 31, 2013:
Balance at January 1, ....................... $ 7,433 $ 6,208 $ 1,814 $ 71 $ 2,037 $1,147 $3,656 $ 54
Total realized/unrealized gains
(losses) included in:
Net income (loss): (1), (2)
Net investment income .................. 10 9 9 — 31 5 8 —
Net investment gains (losses) .............. (31) (33) 8 — (3) (14) 5 —
Net derivative gains (losses) ............... — — — — — — — —
Other revenues ........................ — — — — — — — —
Policyholder benefits and claims ........... — — — — — — — —
Other expenses ........................ — — — — — — — —
OCI ................................... (94) (75) (84) (3) 155 (45) (70) (1)
Purchases (3) ............................. 1,555 1,972 734 — 1,155 546 1,870 —
Sales (3) .................................. (1,178) (999) (128) (6) (399) (450) (814) (7)
Issuances (3) .............................. — — — — — — — —
Settlements (3) ............................. — — — — — — — —
Transfers into Level 3 (4) ..................... 1,092 310 81 — 56 114 33 —
Transfers out of Level 3 (4) ................... (1,639) (688) (199) — (75) (331) (478) (36)
Balance at December 31, .................... $ 7,148 $ 6,704 $ 2,235 $ 62 $ 2,957 $ 972 $4,210 $ 10
Changes in unrealized gains (losses) included in net
income (loss): (5)
Net investment income .................. $ 8 $ 8 $ 9 $ — $ 36 $ 3 $ 1 $ —
Net investment gains (losses) .............. $ (39) $ (3) $ — $ — $ (3) $ (12) $ — $ —
Net derivative gains (losses) ...............$ — $ — $ — $ — $ — $ — $ — $ —
Other revenues ........................ $ — $ — $ — $ — $ — $ — $ — $ —
Policyholder benefits and claims ........... $ — $ — $ — $ — $ — $ — $ — $ —
Other expenses ........................$ — $ — $ — $ — $ — $ — $ — $ —
158 MetLife, Inc.