MetLife 2013 Annual Report Download - page 10
Download and view the complete annual report
Please find page 10 of the 2013 MetLife annual report below. You can navigate through the pages in the report by either clicking on the pages listed below, or by using the keyword search tool below to find specific information within the annual report.-
 1
1 -
 2
2 -
 3
3 -
 4
4 -
 5
5 -
 6
6 -
 7
7 -
 8
8 -
 9
9 -
 10
10 -
 11
11 -
 12
12 -
 13
13 -
 14
14 -
 15
15 -
 16
16 -
 17
17 -
 18
18 -
 19
19 -
 20
20 -
 21
21 -
22
-
23
-
24
-
25
-
26
-
27
-
28
-
29
-
30
-
31
-
32
-
33
-
34
-
35
-
36
-
37
-
38
-
39
-
40
-
41
-
42
-
43
-
44
-
45
-
46
-
47
-
48
-
49
-
50
-
51
-
52
-
53
-
54
-
55
-
56
-
57
-
58
-
59
-
60
-
61
-
62
-
63
-
64
-
65
-
66
-
67
-
68
-
69
-
70
-
71
-
72
-
73
-
74
-
75
-
76
-
77
-
78
-
79
-
80
-
81
-
82
-
83
-
84
-
85
-
86
-
87
-
88
-
89
-
90
-
91
-
92
-
93
-
94
-
95
-
96
-
97
-
98
-
99
-
100
-
101
-
102
-
103
-
104
-
105
-
106
-
107
-
108
-
109
-
110
-
111
-
112
-
113
-
114
-
115
-
116
-
117
-
118
-
119
-
120
-
121
-
122
-
123
-
124
-
125
-
126
-
127
-
128
-
129
-
130
-
131
-
132
-
133
-
134
-
135
-
136
-
137
-
138
-
139
-
140
-
141
-
142
-
143
-
144
-
145
-
146
-
147
-
148
-
149
-
150
-
151
-
152
-
153
-
154
-
155
-
156
-
157
-
158
-
159
-
160
-
161
-
162
-
163
-
164
-
165
-
166
-
167
-
168
-
169
-
170
-
171
-
172
-
173
-
174
-
175
-
176
-
177
-
178
-
179
-
180
-
181
-
182
-
183
-
184
-
185
-
186
-
187
-
188
-
189
-
190
-
191
-
192
-
193
-
194
-
195
-
196
-
197
-
198
-
199
-
200
-
201
-
202
-
203
-
204
-
205
-
206
-
207
-
208
-
209
-
210
-
211
-
212
-
213
-
214
-
215
-
216
-
217
-
218
-
219
-
220
-
221
-
222
-
223
-
224
 |
 |

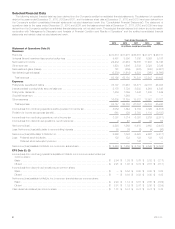
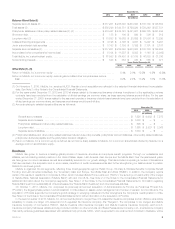
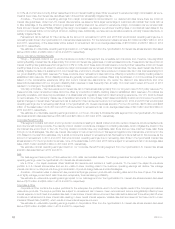
Selected Financial Data
The following selected financial data has been derived from the Company’s audited consolidated financial statements. The statement of operations
data for the years ended December 31, 2013, 2012 and 2011, and the balance sheet data at December 31, 2013 and 2012 have been derived from
the Company’s audited consolidated financial statements included elsewhere herein (the “Consolidated Financial Statements”). The statement of
operations data for the years ended December 31, 2010 and 2009, and the balance sheet data at December 31, 2011, 2010 and 2009 have been
derived from the Company’s audited consolidated financial statements not included herein. The selected financial data set forth below should be readin
conjunction with “Management’s Discussion and Analysis of Financial Condition and Results of Operations” and the audited consolidated financial
statements and related notes included elsewhere herein.
Years Ended December 31,
2013 2012 2011 2010 2009
(In millions, except per share data)
Statement of Operations Data (1)
Revenues
Premiums ................................................................... $37,674 $ 37,975 $ 36,361 $ 27,071 $ 26,157
Universal life and investment-type product policy fees ................................. 9,451 8,556 7,806 6,028 5,197
Net investment income ......................................................... 22,232 21,984 19,585 17,493 14,726
Other revenues ............................................................... 1,920 1,906 2,532 2,328 2,329
Net investment gains (losses) .................................................... 161 (352) (867) (408) (2,901)
Net derivative gains (losses) ..................................................... (3,239) (1,919) 4,824 (265) (4,866)
Total revenues .............................................................. 68,199 68,150 70,241 52,247 40,642
Expenses
Policyholder benefits and claims .................................................. 38,107 37,987 35,471 29,187 28,005
Interest credited to policyholder account balances .................................... 8,179 7,729 5,603 4,919 4,845
Policyholder dividends .......................................................... 1,259 1,369 1,446 1,485 1,649
Goodwill impairment ........................................................... — 1,868 — — —
Other expenses ............................................................... 16,602 17,755 18,537 12,927 10,761
Total expenses ............................................................. 64,147 66,708 61,057 48,518 45,260
Income (loss) from continuing operations before provision for income tax ................... 4,052 1,442 9,184 3,729 (4,618)
Provision for income tax expense (benefit) ........................................... 661 128 2,793 1,110 (2,107)
Income (loss) from continuing operations, net of income tax ............................. 3,391 1,314 6,391 2,619 (2,511)
Income (loss) from discontinued operations, net of income tax ........................... 2 48 24 44 64
Net income (loss) .............................................................. 3,393 1,362 6,415 2,663 (2,447)
Less: Net income (loss) attributable to noncontrolling interests ........................... 25 38 (8) (4) (36)
Net income (loss) attributable to MetLife, Inc. ........................................ 3,368 1,324 6,423 2,667 (2,411)
Less: Preferred stock dividends ................................................. 122 122 122 122 122
Preferred stock redemption premium ........................................ — — 146 — —
Net income (loss) available to MetLife, Inc.’s common shareholders ....................... $ 3,246 $ 1,202 $ 6,155 $ 2,545 $ (2,533)
EPS Data (1), (2)
Income (loss) from continuing operations available to MetLife, Inc.’s common shareholders per
common share:
Basic ..................................................................... $ 2.94 $ 1.08 $ 5.79 $ 2.83 $ (3.17)
Diluted .................................................................... $ 2.91 $ 1.08 $ 5.74 $ 2.81 $ (3.17)
Income (loss) from discontinued operations per common share:
Basic ..................................................................... $ — $ 0.04 $ 0.02 $ 0.05 $ 0.08
Diluted .................................................................... $ — $ 0.04 $ 0.02 $ 0.05 $ 0.08
Net income (loss) available to MetLife, Inc.’s common shareholders per common share:
Basic ..................................................................... $ 2.94 $ 1.12 $ 5.81 $ 2.88 $ (3.09)
Diluted .................................................................... $ 2.91 $ 1.12 $ 5.76 $ 2.86 $ (3.09)
Cash dividends declared per common share ........................................ $ 1.01 $ 0.74 $ 0.74 $ 0.74 $ 0.74
2MetLife, Inc.