MetLife 2013 Annual Report Download - page 65
Download and view the complete annual report
Please find page 65 of the 2013 MetLife annual report below. You can navigate through the pages in the report by either clicking on the pages listed below, or by using the keyword search tool below to find specific information within the annual report.-
 1
1 -
2
-
3
-
4
-
5
-
6
-
7
-
8
-
9
-
10
-
11
-
12
-
13
-
14
-
15
-
16
-
17
-
18
-
19
-
20
-
21
-
22
-
23
-
24
-
25
-
26
-
27
-
28
-
29
-
30
-
31
-
32
-
33
-
34
-
35
-
36
-
37
-
38
-
39
-
40
-
41
-
42
-
43
-
44
-
45
-
46
-
47
-
48
-
49
-
50
-
51
-
52
-
53
-
54
-
 55
55 -
 56
56 -
 57
57 -
 58
58 -
 59
59 -
 60
60 -
 61
61 -
 62
62 -
 63
63 -
 64
64 -
 65
65 -
 66
66 -
 67
67 -
 68
68 -
 69
69 -
 70
70 -
 71
71 -
 72
72 -
 73
73 -
 74
74 -
 75
75 -
76
-
77
-
78
-
79
-
80
-
81
-
82
-
83
-
84
-
85
-
86
-
87
-
88
-
89
-
90
-
91
-
92
-
93
-
94
-
95
-
96
-
97
-
98
-
99
-
100
-
101
-
102
-
103
-
104
-
105
-
106
-
107
-
108
-
109
-
110
-
111
-
112
-
113
-
114
-
115
-
116
-
117
-
118
-
119
-
120
-
121
-
122
-
123
-
124
-
125
-
126
-
127
-
128
-
129
-
130
-
131
-
132
-
133
-
134
-
135
-
136
-
137
-
138
-
139
-
140
-
141
-
142
-
143
-
144
-
145
-
146
-
147
-
148
-
149
-
150
-
151
-
152
-
153
-
154
-
155
-
156
-
157
-
158
-
159
-
160
-
161
-
162
-
163
-
164
-
165
-
166
-
167
-
168
-
169
-
170
-
171
-
172
-
173
-
174
-
175
-
176
-
177
-
178
-
179
-
180
-
181
-
182
-
183
-
184
-
185
-
186
-
187
-
188
-
189
-
190
-
191
-
192
-
193
-
194
-
195
-
196
-
197
-
198
-
199
-
200
-
201
-
202
-
203
-
204
-
205
-
206
-
207
-
208
-
209
-
210
-
211
-
212
-
213
-
214
-
215
-
216
-
217
-
218
-
219
-
220
-
221
-
222
-
223
-
224
 |
 |

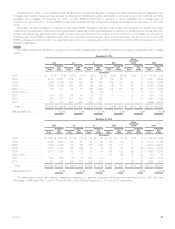
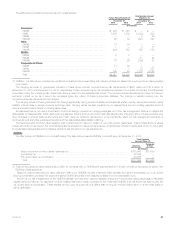
The table below contains the carrying value for guarantees at:
Future Policy Benefits (1) Policyholder Account
Balances (1)
December 31, December 31,
2013 2012 2013 2012
(In millions)
Americas:
GMDB ........................................................... $ 495 $ 343 $ — $ —
GMIB ............................................................ 1,608 1,432 (1,904) 200
GMAB ........................................................... — — 2 23
GMWB ........................................................... 62 30 (441) 428
Asia:
GMDB ........................................................... 33 54 — —
GMAB ........................................................... — — 3 11
GMWB ........................................................... 204 183 129 190
EMEA:
GMDB ........................................................... 6 6 — —
GMAB ........................................................... — — 11 28
GMWB ........................................................... 19 20 (102) 43
Corporate & Other:
GMDB ........................................................... 11 39 — —
GMAB ........................................................... — — 83 387
GMWB ........................................................... 109 95 1,179 2,195
Total ............................................................. $2,547 $2,202 $(1,040) $3,505
(1) GMDB in the table above includes any additional contractual claims associated with riders purchased to assist with covering income taxes payable
upon death.
The carrying amounts for guarantees included in PABs above include nonperformance risk adjustments of $267 million and $1.2 billion at
December 31, 2013 and December 31, 2012, respectively. These nonperformance risk adjustments represent the impact of including a credit spread
when discounting the underlying risk neutral cash flows to determine the estimated fair values. The nonperformance risk adjustment does not have an
economic impact on us as it cannot be monetized given the nature of these policyholder liabilities. The change in valuation arising from the
nonperformance risk adjustment is not hedged.
The carrying values of these guarantees can change significantly during periods of sizable and sustained shifts in equity market performance, equity
volatility, interest rates or foreign currency exchange rates. Carrying values are also impacted by our assumptions around mortality, separate account
returns and policyholder behavior including lapse rates.
As discussed below, we use a combination of product design, reinsurance, hedging strategies, and other risk management actions to mitigate the
risks related to these benefits. Within each type of guarantee, there is a range of product offerings reflecting the changing nature of these products over
time. Changes in product features and terms are in part driven by customer demand but, more importantly, reflect our risk management practices of
continuously evaluating the guaranteed benefits and their associated asset-liability matching.
The sections below provide further detail by total contract account value for certain of our most popular guarantees. Total contract account values
include amounts not reported in the consolidated balance sheets from assumed reinsurance, contractholder-directed investments which do not qualify
for presentation as separate account assets, and amounts included in our general account.
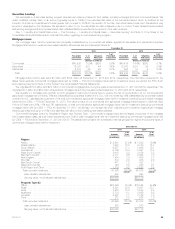
GMDBs
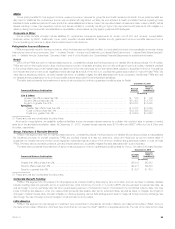
We offer a range of GMDBs to our contractholders. The table below presents GMDBs, by benefit type, at December 31, 2013:
Total Contract
Account Value (1)
Americas Corporate
& Other
(In millions)
Return of premium or five to seven year step-up .............................................. $105,940 $15,660
Annual step-up ........................................................................ 32,346 —
Roll-up and step-up combination .......................................................... 39,638 —
Total ............................................................................... $177,924 $15,660
(1) Total contract account value excludes $2.2 billion for contracts with no GMDBs and approximately $11.9 billion of total contract account value in the
EMEA and Asia segments.
Based on total contract account value, less than 40% of our GMDBs included enhanced death benefits such as the annual step-up or roll-up and
step-up combination products. We expect the above GMDB risk profile to be relatively consistent for the foreseeable future.
As part of our risk management of the GMDB business, we have been opportunistically reinsuring in-force blocks, taking advantage of favorable
capital market conditions. Our approach for such treaties has been to seek coverage for the enhanced GMDBs, such as the annual step-up and the
roll-up and step-up combination. These treaties tend to cover long periods until claims start running off, and are written either on a first dollar basis or
with a deductible.
MetLife, Inc. 57