MetLife 2013 Annual Report Download - page 149
Download and view the complete annual report
Please find page 149 of the 2013 MetLife annual report below. You can navigate through the pages in the report by either clicking on the pages listed below, or by using the keyword search tool below to find specific information within the annual report.-
 1
1 -
2
-
3
-
4
-
5
-
6
-
7
-
8
-
9
-
10
-
11
-
12
-
13
-
14
-
15
-
16
-
17
-
18
-
19
-
20
-
21
-
22
-
23
-
24
-
25
-
26
-
27
-
28
-
29
-
30
-
31
-
32
-
33
-
34
-
35
-
36
-
37
-
38
-
39
-
40
-
41
-
42
-
43
-
44
-
45
-
46
-
47
-
48
-
49
-
50
-
51
-
52
-
53
-
54
-
55
-
56
-
57
-
58
-
59
-
60
-
61
-
62
-
63
-
64
-
65
-
66
-
67
-
68
-
69
-
70
-
71
-
72
-
73
-
74
-
75
-
76
-
77
-
78
-
79
-
80
-
81
-
82
-
83
-
84
-
85
-
86
-
87
-
88
-
89
-
90
-
91
-
92
-
93
-
94
-
95
-
96
-
97
-
98
-
99
-
100
-
101
-
102
-
103
-
104
-
105
-
106
-
107
-
108
-
109
-
110
-
111
-
112
-
113
-
114
-
115
-
116
-
117
-
118
-
119
-
120
-
121
-
122
-
123
-
124
-
125
-
126
-
127
-
128
-
129
-
130
-
131
-
132
-
133
-
134
-
135
-
136
-
137
-
138
-
 139
139 -
 140
140 -
 141
141 -
 142
142 -
 143
143 -
 144
144 -
 145
145 -
 146
146 -
 147
147 -
 148
148 -
 149
149 -
 150
150 -
 151
151 -
 152
152 -
 153
153 -
 154
154 -
 155
155 -
 156
156 -
 157
157 -
 158
158 -
 159
159 -
160
-
161
-
162
-
163
-
164
-
165
-
166
-
167
-
168
-
169
-
170
-
171
-
172
-
173
-
174
-
175
-
176
-
177
-
178
-
179
-
180
-
181
-
182
-
183
-
184
-
185
-
186
-
187
-
188
-
189
-
190
-
191
-
192
-
193
-
194
-
195
-
196
-
197
-
198
-
199
-
200
-
201
-
202
-
203
-
204
-
205
-
206
-
207
-
208
-
209
-
210
-
211
-
212
-
213
-
214
-
215
-
216
-
217
-
218
-
219
-
220
-
221
-
222
-
223
-
224
 |
 |

MetLife, Inc.
Notes to the Consolidated Financial Statements — (Continued)
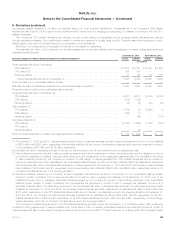
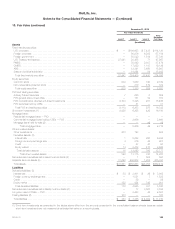
9. Derivatives (continued)
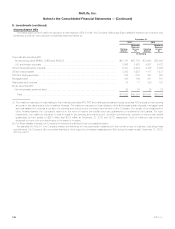
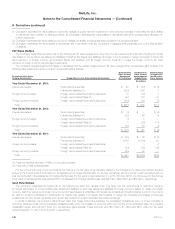
Net Derivative Gains (Losses)
The components of net derivative gains (losses) were as follows:
Years Ended December 31,
2013 2012 2011
(In millions)
Derivatives and hedging gains (losses) (1) ............................................................. $(8,343) $(3,158) $ 6,108
Embedded derivatives ............................................................................ 5,104 1,239 (1,284)
Total net derivative gains (losses) .................................................................. $(3,239) $(1,919) $ 4,824
(1) Includes foreign currency transaction gains (losses) on hedged items in cash flow and non-qualifying hedging relationships, which are not presented
elsewhere in this note.
The following table presents earned income on derivatives:
Years Ended December 31,
2013 2012 2011
(In millions)
Qualifying hedges:
Net investment income ............................................................................... $135 $111 $ 98
Interest credited to policyholder account balances .......................................................... 150 164 214
Other expenses .................................................................................... (6) (5) (4)
Non-qualifying hedges: ................................................................................
Net investment income ............................................................................... (6) (6) (8)
Other revenues ..................................................................................... — 47 75
Net derivative gains (losses) ........................................................................... 328 476 411
Policyholder benefits and claims ....................................................................... (292) (120) 17
Total ........................................................................................... $309 $667 $803
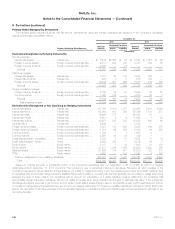
Non-Qualifying Derivatives and Derivatives for Purposes Other Than Hedging
The following table presents the amount and location of gains (losses) recognized in income for derivatives that were not designated or qualifying as
hedging instruments:
Net
Derivative
Gains (Losses)
Net
Investment
Income (1)
Policyholder
Benefits and
Claims (2) Other
Revenues (3)
(In millions)
Year Ended December 31, 2013:
Interest rate derivatives ....................................................... $(3,458) $ — $ (27) $ —
Foreign currency exchange rate derivatives ........................................ (1,716) — — —
Credit derivatives — purchased ................................................ (21) (14) —
Credit derivatives — written .................................................... 130 1 — —
Equity derivatives ............................................................ (3,663) (25) (727) —
Total .................................................................... $(8,728) $(38) $(754) $ —
Year Ended December 31, 2012:
Interest rate derivatives ....................................................... $ (296) $ — $ — $ 28
Foreign currency exchange rate derivatives ........................................ (660) — — —
Credit derivatives — purchased ................................................ (298) (14) — —
Credit derivatives — written .................................................... 150 — — —
Equity derivatives ............................................................ (2,556) (9) (419) —
Total .................................................................... $(3,660) $(23) $(419) $ 28
Year Ended December 31, 2011:
Interest rate derivatives ....................................................... $3,940 $ (1) $ — $236
Foreign currency exchange rate derivatives ........................................ 343 (9) — —
Credit derivatives — purchased ................................................ 250 6 — —
Credit derivatives — written .................................................... (75) (1) — —
Equity derivatives ............................................................ 1,178 (35) (87) —
Total .................................................................... $5,636 $(40) $ (87) $236
MetLife, Inc. 141