MetLife 2013 Annual Report Download - page 198
Download and view the complete annual report
Please find page 198 of the 2013 MetLife annual report below. You can navigate through the pages in the report by either clicking on the pages listed below, or by using the keyword search tool below to find specific information within the annual report.-
 1
1 -
2
-
3
-
4
-
5
-
6
-
7
-
8
-
9
-
10
-
11
-
12
-
13
-
14
-
15
-
16
-
17
-
18
-
19
-
20
-
21
-
22
-
23
-
24
-
25
-
26
-
27
-
28
-
29
-
30
-
31
-
32
-
33
-
34
-
35
-
36
-
37
-
38
-
39
-
40
-
41
-
42
-
43
-
44
-
45
-
46
-
47
-
48
-
49
-
50
-
51
-
52
-
53
-
54
-
55
-
56
-
57
-
58
-
59
-
60
-
61
-
62
-
63
-
64
-
65
-
66
-
67
-
68
-
69
-
70
-
71
-
72
-
73
-
74
-
75
-
76
-
77
-
78
-
79
-
80
-
81
-
82
-
83
-
84
-
85
-
86
-
87
-
88
-
89
-
90
-
91
-
92
-
93
-
94
-
95
-
96
-
97
-
98
-
99
-
100
-
101
-
102
-
103
-
104
-
105
-
106
-
107
-
108
-
109
-
110
-
111
-
112
-
113
-
114
-
115
-
116
-
117
-
118
-
119
-
120
-
121
-
122
-
123
-
124
-
125
-
126
-
127
-
128
-
129
-
130
-
131
-
132
-
133
-
134
-
135
-
136
-
137
-
138
-
139
-
140
-
141
-
142
-
143
-
144
-
145
-
146
-
147
-
148
-
149
-
150
-
151
-
152
-
153
-
154
-
155
-
156
-
157
-
158
-
159
-
160
-
161
-
162
-
163
-
164
-
165
-
166
-
167
-
168
-
169
-
170
-
171
-
172
-
173
-
174
-
175
-
176
-
177
-
178
-
179
-
180
-
181
-
182
-
183
-
184
-
185
-
186
-
187
-
 188
188 -
 189
189 -
 190
190 -
 191
191 -
 192
192 -
 193
193 -
 194
194 -
 195
195 -
 196
196 -
 197
197 -
 198
198 -
 199
199 -
 200
200 -
 201
201 -
 202
202 -
 203
203 -
 204
204 -
 205
205 -
 206
206 -
 207
207 -
 208
208 -
209
-
210
-
211
-
212
-
213
-
214
-
215
-
216
-
217
-
218
-
219
-
220
-
221
-
222
-
223
-
224
 |
 |

MetLife, Inc.
Notes to the Consolidated Financial Statements — (Continued)
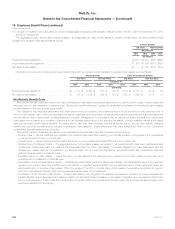
18. Employee Benefit Plans (continued)
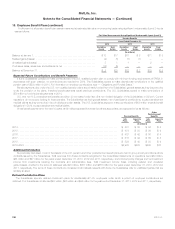
(1) Includes non-qualified unfunded plans, for which the aggregate projected benefit obligation was $1.0 billion and $1.1 billion at December 31, 2013
and 2012, respectively.
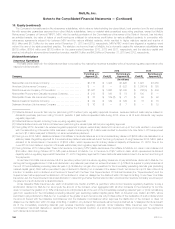
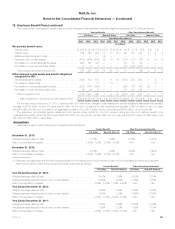
The aggregate pension accumulated benefit obligation and aggregate fair value of plan assets for pension benefit plans with accumulated benefit
obligations in excess of plan assets was as follows:
Pension Benefits
U.S. Plans Non-U.S. Plans
December 31,
2013 2012 2013 2012
(In millions)
Projected benefit obligations ....................................................................... $1,037 $1,323 $644 $690
Accumulated benefit obligations .................................................................... $ 927 $1,166 $579 $651
Fair value of plan assets ........................................................................... $ — $ 157 $167 $144
Information for pension and other postretirement benefit plans with a projected benefit obligation in excess of plan assets were as follows:
Pension Benefits Other Postretirement Benefits
U.S. Plans Non-U.S. Plans U.S. Plans Non-U.S. Plans
December 31,
2013 2012 2013 2012 2013 2012 2013 2012
(In millions)
Projected benefit obligations ...................... $ 1,170 $ 9,480 $ 701 $ 763 $ 1,834 $ 2,375 $ 41 $ 43
Fair value of plan assets ......................... $ 133 $ 7,879 $ 199 $ 188 $ 1,352 $ 1,320 $ 14 $ 15
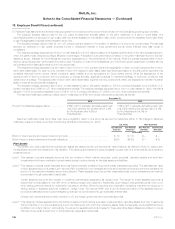
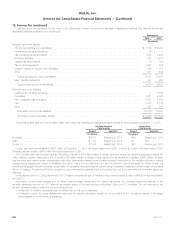
Net Periodic Benefit Costs
Net periodic benefit costs are determined using management estimates and actuarial assumptions to derive service costs, interest costs and
expected return on plan assets for a particular year. Net periodic benefit costs also includes the applicable amortization of net actuarial gains (losses)
and amortization of any prior service costs (credit).
The obligations and expenses associated with these plans require an extensive use of assumptions such as the discount rate, expected rate of
return on plan assets, rate of future compensation increases, healthcare cost trend rates, as well as assumptions regarding participant demographics
such as rate and age of retirements, withdrawal rates and mortality. Management, in consultation with its external consulting actuarial firms, determines
these assumptions based upon a variety of factors such as historical performance of the plan and its assets, currently available market and industry
data and expected benefit payout streams. The assumptions used may differ materially from actual results due to, among other factors, changing
market and economic conditions and changes in participant demographics. These differences may have a significant effect on the Company’s
consolidated financial statements and liquidity.
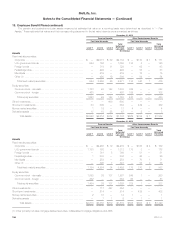
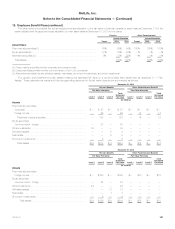
Net periodic pension costs and net periodic other postretirement benefit plan costs are comprised of the following:
‰Service Costs — Service costs are the increase in the projected (expected) PBO resulting from benefits payable to employees of the Subsidiaries
on service rendered during the current year.
‰Interest Costs — Interest costs are the time value adjustment on the projected (expected) PBO at the end of each year.
‰Settlement and Curtailment Costs — The aggregate amount of net gains (losses) recognized in net periodic benefit costs due to settlements and
curtailments. Settlements result from actions that relieve/eliminate the plan’s responsibility for benefit obligations or risks associated with the
obligations or assets used for the settlement. Curtailments result from an event that significantly reduces/eliminates plan participants’ expected
years of future services or benefit accruals.
‰Expected Return on Plan Assets — Expected return on plan assets is the assumed return earned by the accumulated pension and other
postretirement fund assets in a particular year.
‰Amortization of Net Actuarial Gains (Losses) — Actuarial gains and losses result from differences between the actual experience and the expected
experience on pension and other postretirement plan assets or projected (expected) PBO during a particular period. These gains and losses are
accumulated and, to the extent they exceed 10% of the greater of the PBO or the fair value of plan assets, the excess is amortized into pension
and other postretirement benefit costs over the expected service years of the employees.
‰Amortization of Prior Service Costs (Credit) — These costs relate to the recognition of increases or decreases in pension and other postretirement
benefit obligation due to amendments in plans or initiation of new plans. These increases or decreases in obligation are recognized in AOCI at the
time of the amendment. These costs are then amortized to pension and other postretirement benefit costs over the expected service years of the
employees affected by the change.
190 MetLife, Inc.