MetLife 2013 Annual Report Download - page 37
Download and view the complete annual report
Please find page 37 of the 2013 MetLife annual report below. You can navigate through the pages in the report by either clicking on the pages listed below, or by using the keyword search tool below to find specific information within the annual report.-
 1
1 -
2
-
3
-
4
-
5
-
6
-
7
-
8
-
9
-
10
-
11
-
12
-
13
-
14
-
15
-
16
-
17
-
18
-
19
-
20
-
21
-
22
-
23
-
24
-
25
-
26
-
 27
27 -
 28
28 -
 29
29 -
 30
30 -
 31
31 -
 32
32 -
 33
33 -
 34
34 -
 35
35 -
 36
36 -
 37
37 -
 38
38 -
 39
39 -
 40
40 -
 41
41 -
 42
42 -
 43
43 -
 44
44 -
 45
45 -
 46
46 -
 47
47 -
48
-
49
-
50
-
51
-
52
-
53
-
54
-
55
-
56
-
57
-
58
-
59
-
60
-
61
-
62
-
63
-
64
-
65
-
66
-
67
-
68
-
69
-
70
-
71
-
72
-
73
-
74
-
75
-
76
-
77
-
78
-
79
-
80
-
81
-
82
-
83
-
84
-
85
-
86
-
87
-
88
-
89
-
90
-
91
-
92
-
93
-
94
-
95
-
96
-
97
-
98
-
99
-
100
-
101
-
102
-
103
-
104
-
105
-
106
-
107
-
108
-
109
-
110
-
111
-
112
-
113
-
114
-
115
-
116
-
117
-
118
-
119
-
120
-
121
-
122
-
123
-
124
-
125
-
126
-
127
-
128
-
129
-
130
-
131
-
132
-
133
-
134
-
135
-
136
-
137
-
138
-
139
-
140
-
141
-
142
-
143
-
144
-
145
-
146
-
147
-
148
-
149
-
150
-
151
-
152
-
153
-
154
-
155
-
156
-
157
-
158
-
159
-
160
-
161
-
162
-
163
-
164
-
165
-
166
-
167
-
168
-
169
-
170
-
171
-
172
-
173
-
174
-
175
-
176
-
177
-
178
-
179
-
180
-
181
-
182
-
183
-
184
-
185
-
186
-
187
-
188
-
189
-
190
-
191
-
192
-
193
-
194
-
195
-
196
-
197
-
198
-
199
-
200
-
201
-
202
-
203
-
204
-
205
-
206
-
207
-
208
-
209
-
210
-
211
-
212
-
213
-
214
-
215
-
216
-
217
-
218
-
219
-
220
-
221
-
222
-
223
-
224
 |
 |

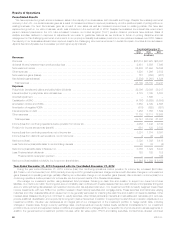
Segment Results and Corporate & Other
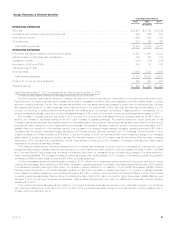
Retail
Years Ended December 31,
2013 2012 2011
(In millions)
OPERATING REVENUES
Premiums .................................................................................... $ 6,528 $ 6,532 $ 6,711
Universal life and investment-type product policy fees .................................................. 4,912 4,561 4,096
Net investment income .......................................................................... 7,898 7,670 7,414
Other revenues ................................................................................ 1,018 879 779
Total operating revenues ...................................................................... 20,356 19,642 19,000
OPERATING EXPENSES
Policyholder benefits and claims and policyholder dividends ............................................. 9,028 9,010 9,220
Interest credited to policyholder account balances .................................................... 2,331 2,375 2,412
Capitalization of DAC ........................................................................... (1,309) (1,753) (2,339)
Amortization of DAC and VOBA ................................................................... 1,384 1,607 1,845
Interest expense on debt ........................................................................ — — 1
Other expenses ............................................................................... 5,084 5,369 5,854
Total operating expenses ...................................................................... 16,518 16,608 16,993
Provision for income tax expense (benefit) ........................................................... 1,314 1,032 672
Operating earnings ............................................................................. $ 2,524 $ 2,002 $ 1,335
Year Ended December 31, 2013 Compared with the Year Ended December 31, 2012
Unless otherwise stated, all amounts (with the exception of sales data) discussed below are net of income tax.
In 2013, we made additional changes to variable annuity guarantee features as we continue to manage sales volume, focusing on pricing
discipline and risk management. These actions, in combination with product changes in 2012, resulted in a $7.2 billion, or 38%, decrease in annuity
sales. Variable and universal life sales were also lower by 18%, mainly driven by the discontinuance of all but one of our secondary guarantees on
universal life products. In our property & casualty business, premiums on new policy sales increased 8% for both our auto and homeowners
businesses as compared to 2012.
A $245 million increase in operating earnings was largely attributable to business growth. This growth was generated, in part, in the life and
annuity businesses, despite the sales declines in those businesses. Our life businesses had positive net flows, mainly in the universal life business,
which is reflected in higher net investment income, partially offset by an increase in DAC amortization. On the annuities side, average separate
account assets grew, driven by strong sales in 2012, resulting in an increase in asset-based fees. In our property & casualty business, an increase in
average premium per policy in both our auto and homeowners businesses contributed to the increase in operating earnings. In addition, we earned
more income on a larger invested asset base, which resulted from a higher amount of allocated equity in the business as compared to 2012.
The rising equity markets increased our average separate account balances driving an increase in asset-based fee income. This continued
positive equity market performance also drove higher net investment income from other limited partnership interests and resulted in lower DAC
amortization. These positive impacts were partially offset by higher asset-based commissions, which are also, in part, determined by separate
account balances and higher costs associated with our variable annuity guaranteed minimum death benefits (“GMDBs”). The sustained low interest
rate environment resulted in a decline in net investment income on our fixed maturity securities and mortgage loans as proceeds from maturing
investments are reinvested at lower yields. Additionally, we had a lower interest crediting rate on allocated equity in 2013, which resulted in lower net
investment income. These negative interest rate impacts were partially offset by higher income earned on interest rate derivatives and lower interest
credited expense as we reduced interest credited rates on contracts with discretionary rate reset provisions. Lower returns on real estate joint
ventures also decreased operating earnings. The net impact of these items resulted in a $174 million increase in operating earnings. Also, the impact
of the sustained low interest rate environment contributed to less favorable experience resulting in a reduction to our dividend scale, mainly within the
closed block, which was announced in the fourth quarter of 2012. This dividend action favorably impacted operating earnings by $61 million. With
respect to the results of the closed block, the impact of this dividend action was more than offset by other unfavorable earnings drivers that also
affected the closed block and have been incorporated in these discussions.
Less favorable mortality experience in the variable and universal life, and income annuities businesses, partially offset by increases in the
traditional life business, resulted in a $20 million decrease in operating earnings. This decrease was more than offset by the $26 million charge in
2012 for the expected acceleration of benefit payments to policyholders under a multi-state examination related to unclaimed property. In addition,
unfavorable morbidity experience in our individual income disability business resulted in a $6 million decrease in operating earnings. Our property&
casualty business non-catastrophe claim costs increased $33 million in 2013, mainly the result of higher frequencies in both our auto and
homeowners businesses, as well as higher severities in our homeowners business, partially offset by lower severities in our auto business.
Catastrophe-related losses decreased $28 million as compared to 2012, primarily due to Superstorm Sandy in 2012. The impact of the items
discussed above related to our property & casualty business can be seen in the unfavorable change in the combined ratio, excluding catastrophes,
to 86.5% in 2013, compared to 85.8% in 2012, as well as a favorable change in the combined ratio, including catastrophes, to 95.7% in 2013
compared to 97.9% in 2012.
MetLife, Inc. 29