MetLife 2013 Annual Report Download - page 134
Download and view the complete annual report
Please find page 134 of the 2013 MetLife annual report below. You can navigate through the pages in the report by either clicking on the pages listed below, or by using the keyword search tool below to find specific information within the annual report.-
 1
1 -
2
-
3
-
4
-
5
-
6
-
7
-
8
-
9
-
10
-
11
-
12
-
13
-
14
-
15
-
16
-
17
-
18
-
19
-
20
-
21
-
22
-
23
-
24
-
25
-
26
-
27
-
28
-
29
-
30
-
31
-
32
-
33
-
34
-
35
-
36
-
37
-
38
-
39
-
40
-
41
-
42
-
43
-
44
-
45
-
46
-
47
-
48
-
49
-
50
-
51
-
52
-
53
-
54
-
55
-
56
-
57
-
58
-
59
-
60
-
61
-
62
-
63
-
64
-
65
-
66
-
67
-
68
-
69
-
70
-
71
-
72
-
73
-
74
-
75
-
76
-
77
-
78
-
79
-
80
-
81
-
82
-
83
-
84
-
85
-
86
-
87
-
88
-
89
-
90
-
91
-
92
-
93
-
94
-
95
-
96
-
97
-
98
-
99
-
100
-
101
-
102
-
103
-
104
-
105
-
106
-
107
-
108
-
109
-
110
-
111
-
112
-
113
-
114
-
115
-
116
-
117
-
118
-
119
-
120
-
121
-
122
-
123
-
 124
124 -
 125
125 -
 126
126 -
 127
127 -
 128
128 -
 129
129 -
 130
130 -
 131
131 -
 132
132 -
 133
133 -
 134
134 -
 135
135 -
 136
136 -
 137
137 -
 138
138 -
 139
139 -
 140
140 -
 141
141 -
 142
142 -
 143
143 -
 144
144 -
145
-
146
-
147
-
148
-
149
-
150
-
151
-
152
-
153
-
154
-
155
-
156
-
157
-
158
-
159
-
160
-
161
-
162
-
163
-
164
-
165
-
166
-
167
-
168
-
169
-
170
-
171
-
172
-
173
-
174
-
175
-
176
-
177
-
178
-
179
-
180
-
181
-
182
-
183
-
184
-
185
-
186
-
187
-
188
-
189
-
190
-
191
-
192
-
193
-
194
-
195
-
196
-
197
-
198
-
199
-
200
-
201
-
202
-
203
-
204
-
205
-
206
-
207
-
208
-
209
-
210
-
211
-
212
-
213
-
214
-
215
-
216
-
217
-
218
-
219
-
220
-
221
-
222
-
223
-
224
 |
 |

MetLife, Inc.
Notes to the Consolidated Financial Statements — (Continued)
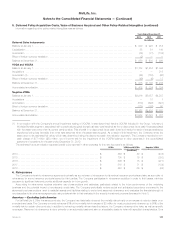
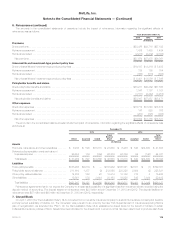
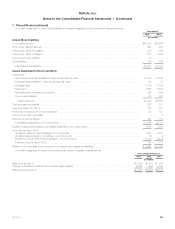
8. Investments (continued)
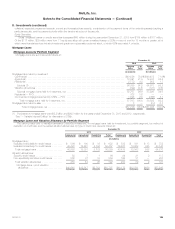
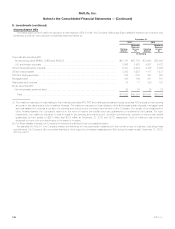
Valuation Allowance Rollforward by Portfolio Segment
The changes in the valuation allowance, by portfolio segment, were as follows:
Commercial Agricultural Residential Total
(In millions)
Balance at January 1, 2011 ................................................. $562 $88 $14 $664
Provision (release) ......................................................... (152) (3) 10 (145)
Charge-offs, net of recoveries ................................................ (12) (4) (3) (19)
Transfers to held-for-sale (1) ................................................. — — (19) (19)
Balance at December 31, 2011 .............................................. 398 81 2 481
Provision (release) ......................................................... (92) — 6 (86)
Charge-offs, net of recoveries ................................................ (13) (24) — (37)
Transfers to held-for-sale (1) ................................................. — (5) (6) (11)
Balance at December 31, 2012 .............................................. 293 52 2 347
Provision (release) ......................................................... (35) 4 18 (13)
Charge-offs, net of recoveries ................................................ — (12) — (12)
Transfers to held-for-sale .................................................... — — — —
Balance at December 31, 2013 .............................................. $258 $44 $20 $322
(1) The valuation allowance on and the related carrying value of certain residential mortgage loans held-for-investment were transferred to mortgage
loans held-for-sale in connection with the MetLife Bank Divestiture. See Note 3.
Valuation Allowance Methodology
Mortgage loans are considered to be impaired when it is probable that, based upon current information and events, the Company will be unable
to collect all amounts due under the loan agreement. Specific valuation allowances are established using the same methodology for all three portfolio
segments as the excess carrying value of a loan over either (i) the present value of expected future cash flows discounted at the loan’s original
effective interest rate, (ii) the estimated fair value of the loan’s underlying collateral if the loan is in the process of foreclosure or otherwise collateral
dependent, or (iii) the loan’s observable market price. A common evaluation framework is used for establishing non-specific valuation allowances for
all loan portfolio segments; however, a separate non-specific valuation allowance is calculated and maintained for each loan portfolio segment thatis
based on inputs unique to each loan portfolio segment. Non-specific valuation allowances are established for pools of loans with similar risk
characteristics where a property-specific or market-specific risk has not been identified, but for which the Company expects to incur a credit loss.
These evaluations are based upon several loan portfolio segment-specific factors, including the Company’s experience for loan losses, defaults and
loss severity, and loss expectations for loans with similar risk characteristics. These evaluations are revised as conditions change and new information
becomes available.
Commercial and Agricultural Mortgage Loan Portfolio Segments
The Company typically uses several years of historical experience in establishing non-specific valuation allowances which captures multiple
economic cycles. For evaluations of commercial mortgage loans, in addition to historical experience, management considers factors that include the
impact of a rapid change to the economy, which may not be reflected in the loan portfolio, and recent loss and recovery trend experience as
compared to historical loss and recovery experience. For evaluations of agricultural mortgage loans, in addition to historical experience, management
considers factors that include increased stress in certain sectors, which may be evidenced by higher delinquency rates, or a change in the number of
higher risk loans. On a quarterly basis, management incorporates the impact of these current market events and conditions on historical experience in
determining the non-specific valuation allowance established for commercial and agricultural mortgage loans.
All commercial mortgage loans are reviewed on an ongoing basis which may include an analysis of the property financial statements and rent roll,
lease rollover analysis, property inspections, market analysis, estimated valuations of the underlying collateral, loan-to-value ratios, debt service
coverage ratios, and tenant creditworthiness. All agricultural mortgage loans are monitored on an ongoing basis. The monitoring process focuses on
higher risk loans, which include those that are classified as restructured, delinquent or in foreclosure, as well as loans with higher loan-to-value ratios
and lower debt service coverage ratios. The monitoring process for agricultural mortgage loans is generally similar to the commercial mortgage loan
monitoring process, with a focus on higher risk loans, including reviews on a geographic and property-type basis. Higher risk loans are reviewed
individually on an ongoing basis for potential credit loss and specific valuation allowances are established using the methodology described above.
Quarterly, the remaining loans are reviewed on a pool basis by aggregating groups of loans that have similar risk characteristics for potential credit
loss, and non-specific valuation allowances are established as described above using inputs that are unique to each segment of the loan portfolio.
For commercial mortgage loans, the primary credit quality indicator is the debt service coverage ratio, which compares a property’s net operating
income to amounts needed to service the principal and interest due under the loan. Generally, the lower the debt service coverage ratio, the higher
the risk of experiencing a credit loss. The Company also reviews the loan-to-value ratio of its commercial mortgage loan portfolio. Loan-to-value ratios
compare the unpaid principal balance of the loan to the estimated fair value of the underlying collateral. Generally, the higher the loan-to-value ratio,
the higher the risk of experiencing a credit loss. The debt service coverage ratio and loan-to-value ratio, as well as the values utilized in calculating
these ratios, are updated annually, on a rolling basis, with a portion of the loan portfolio updated each quarter.
For agricultural mortgage loans, the Company’s primary credit quality indicator is the loan-to-value ratio. The values utilized in calculating this ratio
are developed in connection with the ongoing review of the agricultural mortgage loan portfolio and are routinely updated.
Residential Mortgage Loan Portfolio Segment
The Company’s residential mortgage loan portfolio is comprised primarily of closed end, amortizing residential mortgage loans. For evaluations of
residential mortgage loans, the key inputs of expected frequency and expected loss reflect current market conditions, with expected frequency
adjusted, when appropriate, for differences from market conditions and the Company’s historical experience. In contrast to the commercial and
126 MetLife, Inc.