MetLife 2013 Annual Report Download - page 137
Download and view the complete annual report
Please find page 137 of the 2013 MetLife annual report below. You can navigate through the pages in the report by either clicking on the pages listed below, or by using the keyword search tool below to find specific information within the annual report.-
 1
1 -
2
-
3
-
4
-
5
-
6
-
7
-
8
-
9
-
10
-
11
-
12
-
13
-
14
-
15
-
16
-
17
-
18
-
19
-
20
-
21
-
22
-
23
-
24
-
25
-
26
-
27
-
28
-
29
-
30
-
31
-
32
-
33
-
34
-
35
-
36
-
37
-
38
-
39
-
40
-
41
-
42
-
43
-
44
-
45
-
46
-
47
-
48
-
49
-
50
-
51
-
52
-
53
-
54
-
55
-
56
-
57
-
58
-
59
-
60
-
61
-
62
-
63
-
64
-
65
-
66
-
67
-
68
-
69
-
70
-
71
-
72
-
73
-
74
-
75
-
76
-
77
-
78
-
79
-
80
-
81
-
82
-
83
-
84
-
85
-
86
-
87
-
88
-
89
-
90
-
91
-
92
-
93
-
94
-
95
-
96
-
97
-
98
-
99
-
100
-
101
-
102
-
103
-
104
-
105
-
106
-
107
-
108
-
109
-
110
-
111
-
112
-
113
-
114
-
115
-
116
-
117
-
118
-
119
-
120
-
121
-
122
-
123
-
124
-
125
-
126
-
 127
127 -
 128
128 -
 129
129 -
 130
130 -
 131
131 -
 132
132 -
 133
133 -
 134
134 -
 135
135 -
 136
136 -
 137
137 -
 138
138 -
 139
139 -
 140
140 -
 141
141 -
 142
142 -
 143
143 -
 144
144 -
 145
145 -
 146
146 -
 147
147 -
148
-
149
-
150
-
151
-
152
-
153
-
154
-
155
-
156
-
157
-
158
-
159
-
160
-
161
-
162
-
163
-
164
-
165
-
166
-
167
-
168
-
169
-
170
-
171
-
172
-
173
-
174
-
175
-
176
-
177
-
178
-
179
-
180
-
181
-
182
-
183
-
184
-
185
-
186
-
187
-
188
-
189
-
190
-
191
-
192
-
193
-
194
-
195
-
196
-
197
-
198
-
199
-
200
-
201
-
202
-
203
-
204
-
205
-
206
-
207
-
208
-
209
-
210
-
211
-
212
-
213
-
214
-
215
-
216
-
217
-
218
-
219
-
220
-
221
-
222
-
223
-
224
 |
 |

MetLife, Inc.
Notes to the Consolidated Financial Statements — (Continued)
8. Investments (continued)
Other Invested Assets
Other invested assets is comprised primarily of freestanding derivatives with positive estimated fair values (see Note 9), tax credit and renewable
energy partnerships, and leveraged leases.
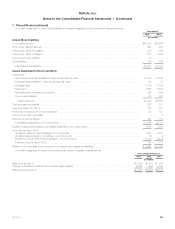
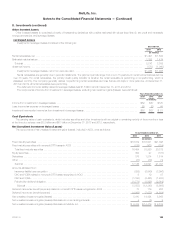
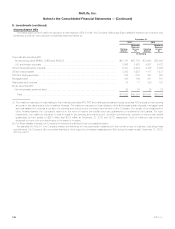
Leveraged Leases
Investment in leveraged leases consisted of the following at:
December 31,
2013 2012
(In millions)
Rental receivables, net ..................................................................................... $1,491 $ 1,564
Estimated residual values ................................................................................... 1,325 1,474
Subtotal .............................................................................................. 2,816 3,038
Unearned income ......................................................................................... (870) (1,040)
Investment in leveraged leases, net of non-recourse debt ...................................................... $1,946 $ 1,998
Rental receivables are generally due in periodic installments. The payment periods range from one to 15 years but in certain circumstances can be
over 30 years. For rental receivables, the primary credit quality indicator is whether the rental receivable is performing or nonperforming, which is
assessed monthly. The Company generally defines nonperforming rental receivables as those that are 90 days or more past due. At December 31,
2013 and 2012, all rental receivables were performing.
The deferred income tax liability related to leveraged leases was $1.6 billion at both December 31, 2013 and 2012.
The components of income from investment in leveraged leases, excluding net investment gains (losses), were as follows:
Years Ended December 31,
2013 2012 2011
(In millions)
Income from investment in leveraged leases ................................................................ $82 $57 $125
Less: Income tax expense on leveraged leases ............................................................. 29 20 44
Investment income after income tax from investment in leveraged leases .......................................... $53 $37 $ 81
Cash Equivalents
The carrying value of cash equivalents, which includes securities and other investments with an original or remaining maturity of three months or less
at the time of purchase, was $3.8 billion and $6.1 billion at December 31, 2013 and 2012, respectively.
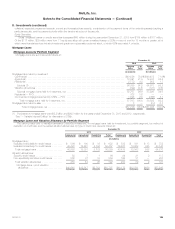
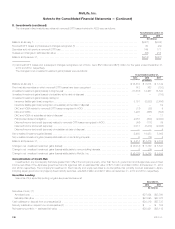
Net Unrealized Investment Gains (Losses)
The components of net unrealized investment gains (losses), included in AOCI, were as follows:
Years Ended December 31,
2013 2012 2011
(In millions)
Fixed maturity securities ........................................................................ $16,672 $ 33,641 $21,096
Fixed maturity securities with noncredit OTTI losses in AOCI ............................................ (218) (361) (724)
Total fixed maturity securities ................................................................... 16,454 33,280 20,372
Equity securities ............................................................................... 390 97 (167)
Derivatives ................................................................................... 375 1,274 1,514
Other ....................................................................................... (73) (30) 72
Subtotal ................................................................................... 17,146 34,621 21,791
Amounts allocated from:
Insurance liability loss recognition ............................................................... (898) (6,049) (3,996)
DAC and VOBA related to noncredit OTTI losses recognized in AOCI ................................... 6 19 47
DAC and VOBA ............................................................................. (1,190) (2,485) (1,800)
Policyholder dividend obligation ................................................................. (1,771) (3,828) (2,919)
Subtotal ................................................................................. (3,853) (12,343) (8,668)
Deferred income tax benefit (expense) related to noncredit OTTI losses recognized in AOCI .................... 73 119 236
Deferred income tax benefit (expense) ............................................................. (4,956) (7,973) (4,694)
Net unrealized investment gains (losses) ............................................................ 8,410 14,424 8,665
Net unrealized investment gains (losses) attributable to noncontrolling interests .............................. 4 (5) 9
Net unrealized investment gains (losses) attributable to MetLife, Inc. ...................................... $ 8,414 $ 14,419 $ 8,674
MetLife, Inc. 129