MetLife 2013 Annual Report Download - page 122
Download and view the complete annual report
Please find page 122 of the 2013 MetLife annual report below. You can navigate through the pages in the report by either clicking on the pages listed below, or by using the keyword search tool below to find specific information within the annual report.-
 1
1 -
2
-
3
-
4
-
5
-
6
-
7
-
8
-
9
-
10
-
11
-
12
-
13
-
14
-
15
-
16
-
17
-
18
-
19
-
20
-
21
-
22
-
23
-
24
-
25
-
26
-
27
-
28
-
29
-
30
-
31
-
32
-
33
-
34
-
35
-
36
-
37
-
38
-
39
-
40
-
41
-
42
-
43
-
44
-
45
-
46
-
47
-
48
-
49
-
50
-
51
-
52
-
53
-
54
-
55
-
56
-
57
-
58
-
59
-
60
-
61
-
62
-
63
-
64
-
65
-
66
-
67
-
68
-
69
-
70
-
71
-
72
-
73
-
74
-
75
-
76
-
77
-
78
-
79
-
80
-
81
-
82
-
83
-
84
-
85
-
86
-
87
-
88
-
89
-
90
-
91
-
92
-
93
-
94
-
95
-
96
-
97
-
98
-
99
-
100
-
101
-
102
-
103
-
104
-
105
-
106
-
107
-
108
-
109
-
110
-
111
-
 112
112 -
 113
113 -
 114
114 -
 115
115 -
 116
116 -
 117
117 -
 118
118 -
 119
119 -
 120
120 -
 121
121 -
 122
122 -
 123
123 -
 124
124 -
 125
125 -
 126
126 -
 127
127 -
 128
128 -
 129
129 -
 130
130 -
 131
131 -
 132
132 -
133
-
134
-
135
-
136
-
137
-
138
-
139
-
140
-
141
-
142
-
143
-
144
-
145
-
146
-
147
-
148
-
149
-
150
-
151
-
152
-
153
-
154
-
155
-
156
-
157
-
158
-
159
-
160
-
161
-
162
-
163
-
164
-
165
-
166
-
167
-
168
-
169
-
170
-
171
-
172
-
173
-
174
-
175
-
176
-
177
-
178
-
179
-
180
-
181
-
182
-
183
-
184
-
185
-
186
-
187
-
188
-
189
-
190
-
191
-
192
-
193
-
194
-
195
-
196
-
197
-
198
-
199
-
200
-
201
-
202
-
203
-
204
-
205
-
206
-
207
-
208
-
209
-
210
-
211
-
212
-
213
-
214
-
215
-
216
-
217
-
218
-
219
-
220
-
221
-
222
-
223
-
224
 |
 |

MetLife, Inc.
Notes to the Consolidated Financial Statements — (Continued)
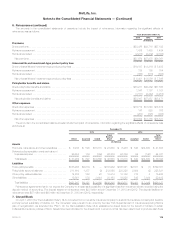
4. Insurance (continued)
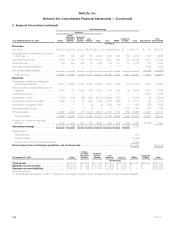
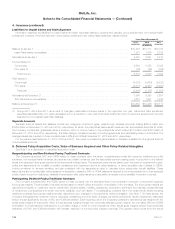
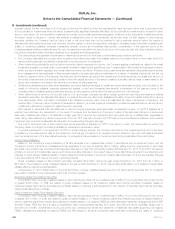
Liabilities for Unpaid Claims and Claim Expenses
Information regarding the liabilities for unpaid claims and claim expenses relating to property and casualty, group accident and non-medical health
policies and contracts, which are reported in future policy benefits and other policy-related balances, was as follows:
Years Ended December 31,
2013 2012 2011
(In millions)
Balance at January 1, ........................................................................... $10,436 $10,117 $10,708
Less: Reinsurance recoverables ................................................................. 1,581 1,436 2,198
Net balance at January 1, ....................................................................... 8,855 8,681 8,510
Incurred related to:
Current year ................................................................................ 8,660 8,399 9,028
Prior years (1) ............................................................................... (86) (69) (199)
Total incurred ............................................................................. 8,574 8,330 8,829
Paid related to:
Current year ................................................................................ (6,083) (5,689) (6,238)
Prior years .................................................................................. (2,377) (2,467) (2,420)
Total paid ................................................................................ (8,460) (8,156) (8,658)
Net balance at December 31, .................................................................... 8,969 8,855 8,681
Add: Reinsurance recoverables ................................................................. 1,661 1,581 1,436
Balance at December 31, ....................................................................... $10,630 $10,436 $10,117
(1) During 2013, 2012 and 2011, as a result of changes in estimates of insured events in the respective prior year, claims and claim adjustment
expenses associated with prior years decreased due to a reduction in prior year automobile bodily injury and homeowners’ severity and improved
loss ratio for non-medical health claim liabilities.
Separate Accounts
Separate account assets and liabilities include two categories of account types: pass-through separate accounts totaling $265.4 billion and
$185.9 billion at December 31, 2013 and 2012, respectively, for which the policyholder assumes all investment risk, and separate accounts for which
the Company contractually guarantees either a minimum return or account value to the policyholder which totaled $51.8 billion and $49.5 billion at
December 31, 2013 and 2012, respectively. The latter category consisted primarily of funding agreements and participating close-out contracts. The
average interest rate credited on these contracts was 2.23% and 2.80% at December 31, 2013 and 2012, respectively.
For the years ended December 31, 2013, 2012 and 2011, there were no investment gains (losses) on transfers of assets from the general account
to the separate accounts.
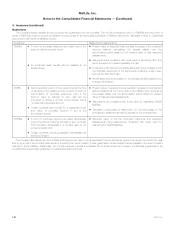
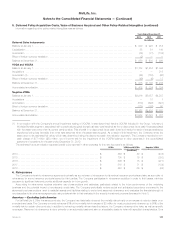
5. Deferred Policy Acquisition Costs, Value of Business Acquired and Other Policy-Related Intangibles
See Note 1 for a description of capitalized acquisition costs.
Nonparticipating and Non-Dividend-Paying Traditional Contracts
The Company amortizes DAC and VOBA related to these contracts (term insurance, nonparticipating whole life insurance, traditional group life
insurance, non-medical health insurance, and accident and health insurance) over the appropriate premium paying period in proportion to the historic
actual and expected future gross premiums that were set at contract issue. The expected premiums are based upon the premium requirement of each
policy and assumptions for mortality, morbidity, persistency and investment returns at policy issuance, or policy acquisition (as it relates to VOBA),
include provisions for adverse deviation, and are consistent with the assumptions used to calculate future policyholder benefit liabilities. These
assumptions are not revised after policy issuance or acquisition unless the DAC or VOBA balance is deemed to be unrecoverable from future expected
profits. Absent a premium deficiency, variability in amortization after policy issuance or acquisition is caused only by variability in premium volumes.
Participating, Dividend-Paying Traditional Contracts
The Company amortizes DAC and VOBA related to these contracts over the estimated lives of the contracts in proportion to actual and expected
future gross margins. The amortization includes interest based on rates in effect at inception or acquisition of the contracts. The future gross margins are
dependent principally on investment returns, policyholder dividend scales, mortality, persistency, expenses to administer the business, creditworthiness
of reinsurance counterparties and certain economic variables, such as inflation. For participating contracts within the closed block (dividend-paying
traditional contracts) future gross margins are also dependent upon changes in the policyholder dividend obligation. See Note 7. Of these factors, the
Company anticipates that investment returns, expenses, persistency and other factor changes, as well as policyholder dividend scales are reasonably
likely to impact significantly the rate of DAC and VOBA amortization. Each reporting period, the Company updates the estimated gross margins with the
actual gross margins for that period. When the actual gross margins change from previously estimated gross margins, the cumulative DAC and VOBA
amortization is re-estimated and adjusted by a cumulative charge or credit to current operations. When actual gross margins exceed those previously
estimated, the DAC and VOBA amortization will increase, resulting in a current period charge to earnings. The opposite result occurs when the actual
114 MetLife, Inc.