MetLife 2013 Annual Report Download - page 29
Download and view the complete annual report
Please find page 29 of the 2013 MetLife annual report below. You can navigate through the pages in the report by either clicking on the pages listed below, or by using the keyword search tool below to find specific information within the annual report.-
 1
1 -
2
-
3
-
4
-
5
-
6
-
7
-
8
-
9
-
10
-
11
-
12
-
13
-
14
-
15
-
16
-
17
-
18
-
 19
19 -
 20
20 -
 21
21 -
 22
22 -
 23
23 -
 24
24 -
 25
25 -
 26
26 -
 27
27 -
 28
28 -
 29
29 -
 30
30 -
 31
31 -
 32
32 -
 33
33 -
 34
34 -
 35
35 -
 36
36 -
 37
37 -
 38
38 -
 39
39 -
40
-
41
-
42
-
43
-
44
-
45
-
46
-
47
-
48
-
49
-
50
-
51
-
52
-
53
-
54
-
55
-
56
-
57
-
58
-
59
-
60
-
61
-
62
-
63
-
64
-
65
-
66
-
67
-
68
-
69
-
70
-
71
-
72
-
73
-
74
-
75
-
76
-
77
-
78
-
79
-
80
-
81
-
82
-
83
-
84
-
85
-
86
-
87
-
88
-
89
-
90
-
91
-
92
-
93
-
94
-
95
-
96
-
97
-
98
-
99
-
100
-
101
-
102
-
103
-
104
-
105
-
106
-
107
-
108
-
109
-
110
-
111
-
112
-
113
-
114
-
115
-
116
-
117
-
118
-
119
-
120
-
121
-
122
-
123
-
124
-
125
-
126
-
127
-
128
-
129
-
130
-
131
-
132
-
133
-
134
-
135
-
136
-
137
-
138
-
139
-
140
-
141
-
142
-
143
-
144
-
145
-
146
-
147
-
148
-
149
-
150
-
151
-
152
-
153
-
154
-
155
-
156
-
157
-
158
-
159
-
160
-
161
-
162
-
163
-
164
-
165
-
166
-
167
-
168
-
169
-
170
-
171
-
172
-
173
-
174
-
175
-
176
-
177
-
178
-
179
-
180
-
181
-
182
-
183
-
184
-
185
-
186
-
187
-
188
-
189
-
190
-
191
-
192
-
193
-
194
-
195
-
196
-
197
-
198
-
199
-
200
-
201
-
202
-
203
-
204
-
205
-
206
-
207
-
208
-
209
-
210
-
211
-
212
-
213
-
214
-
215
-
216
-
217
-
218
-
219
-
220
-
221
-
222
-
223
-
224
 |
 |

investments supporting unit-linked variable annuity type liabilities, which do not qualify as separate account assets. The returns on these
contractholder-directed unit-linked investments, which can vary significantly from period to period, include changes in estimated fair value subsequent
to purchase, inure to contractholders and are offset in earnings by a corresponding change in policyholder account balances (“PABs”) through interest
credited to policyholder account balances.
The composition of the investment portfolio of each business segment is tailored to the specific characteristics of its insurance liabilities, causing
certain portfolios to be shorter in duration and others to be longer in duration. Accordingly, certain portfolios are more heavily weighted in longer
duration, higher yielding fixed maturity securities, or certain sub-sectors of fixed maturity securities, than other portfolios.
We purchase investments to support our insurance liabilities and not to generate net investment gains and losses. However, net investment gains
and losses are incurred and can change significantly from period to period due to changes in external influences, including changes in market factors
such as interest rates, foreign currency exchange rates, credit spreads and equity markets; counterparty specific factors such as financial
performance, credit rating and collateral valuation; and internal factors such as portfolio rebalancing. Changes in these factors from period to period
can significantly impact the levels of both impairments and realized gains and losses on investments sold.
We use freestanding interest rate, equity, credit and currency derivatives to hedge certain invested assets and insurance liabilities. Certain of these
hedges are designated and qualify as accounting hedges, which reduce volatility in earnings. For those hedges not designated as accounting hedges,
changes in market factors lead to the recognition of fair value changes in net derivative gains (losses) generally without an offsetting gain or loss
recognized in earnings for the item being hedged.
Certain variable annuity products with guaranteed minimum benefits contain embedded derivatives that are measured at estimated fair value
separately from the host variable annuity contract, with changes in estimated fair value recorded in net derivative gains (losses). We use freestanding
derivatives to hedge the market risks inherent in these variable annuity guarantees. The valuation of these embedded derivatives includes a
nonperformance risk adjustment, which is unhedged and can be a significant driver of net derivative gains (losses) but does not have an economic
impact on us.
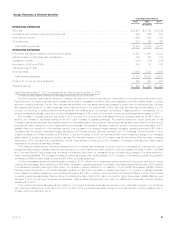
The variable annuity embedded derivatives and associated freestanding derivative hedges are collectively referred to as “VA program derivatives” in
the following table. All other derivatives that are economic hedges of certain invested assets and insurance liabilities are referred to as “non-VA program
derivatives” in the following table. The table below presents the impact on net derivative gains (losses) from non-VA program derivatives and VA
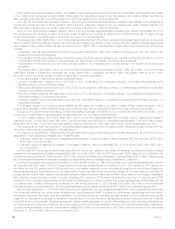
program derivatives:
Years Ended
December 31,
2013 2012
(In millions)
Non-VA program derivatives
Interest rate ........................................................................................... $(1,609) $ 271
Foreign currency exchange rate ........................................................................... (1,225) (426)
Credit ................................................................................................ 187 (105)
Equity ............................................................................................... (61) 1
Non-VA embedded derivatives ............................................................................ 123 (61)
Total non-VA program derivatives ........................................................................ (2,585) (320)
VA program derivatives
Market risks in embedded derivatives ....................................................................... 6,101 4,303
Nonperformance risk on embedded derivatives ............................................................... (952) (1,659)
Other risks in embedded derivatives ........................................................................ (169) (1,344)
Total embedded derivatives ............................................................................. 4,980 1,300
Freestanding derivatives hedging embedded derivatives ........................................................ (5,634) (2,899)
Total VA program derivatives ............................................................................ (654) (1,599)
Net derivative gains (losses) ............................................................................ $(3,239) $(1,919)
The unfavorable change in net derivative gains (losses) on non-VA program derivatives was $2.3 billion ($1.5 billion, net of income tax). This was
primarily due to long-term interest rates increasing more in 2013 than in 2012, unfavorably impacting receive-fixed interest rate swaps, net long interest
rate floors and receiver swaptions. These freestanding derivatives were primarily hedging long duration liability portfolios. The weakening of the
Japanese yen relative to other key currencies unfavorably impacted foreign currency forwards and futures that primarily hedge certain bonds. Because
certain of these hedging strategies are not designated or do not qualify as accounting hedges, the changes in the estimated fair value of these
freestanding derivatives are recognized in net derivative gains (losses) without an offsetting gain or loss recognized in earnings for the item being
hedged.
The favorable change in net derivative gains (losses) on VA program derivatives was $945 million ($614 million, net of income tax). This was due to
a favorable change of $1.2 billion ($763 million, net of income tax) on other risks in embedded derivatives, a favorable change of $707 million
($460 million, net of income tax) related to the change in the nonperformance risk adjustment on embedded derivatives and an unfavorable change of
$937 million ($609 million, net of income tax) on market risks in embedded derivatives, net of the impact of freestanding derivatives hedging those
risks. Other risks relate primarily to the impact of policyholder behavior and other non-market risks that generally cannot be hedged.
The nonperformance risk adjustment loss of $952 million ($619 million, net of income tax) in 2013 was comprised of a loss of $337 million due to a
decrease in our own credit spread, as well as a loss of $615 million due to the impact of changes in capital market inputs, such as long-term interest
rates and key equity index levels, on the variable annuity guarantees. We calculate the nonperformance risk adjustment as the change in the
embedded derivative discounted at the risk adjusted rate (which includes our own credit spread to the extent that the embedded derivative is in-the-
money) less the change in the embedded derivative discounted at the risk free rate.
MetLife, Inc. 21