MetLife 2013 Annual Report Download - page 70
Download and view the complete annual report
Please find page 70 of the 2013 MetLife annual report below. You can navigate through the pages in the report by either clicking on the pages listed below, or by using the keyword search tool below to find specific information within the annual report.-
 1
1 -
2
-
3
-
4
-
5
-
6
-
7
-
8
-
9
-
10
-
11
-
12
-
13
-
14
-
15
-
16
-
17
-
18
-
19
-
20
-
21
-
22
-
23
-
24
-
25
-
26
-
27
-
28
-
29
-
30
-
31
-
32
-
33
-
34
-
35
-
36
-
37
-
38
-
39
-
40
-
41
-
42
-
43
-
44
-
45
-
46
-
47
-
48
-
49
-
50
-
51
-
52
-
53
-
54
-
55
-
56
-
57
-
58
-
59
-
 60
60 -
 61
61 -
 62
62 -
 63
63 -
 64
64 -
 65
65 -
 66
66 -
 67
67 -
 68
68 -
 69
69 -
 70
70 -
 71
71 -
 72
72 -
 73
73 -
 74
74 -
 75
75 -
 76
76 -
 77
77 -
 78
78 -
 79
79 -
 80
80 -
81
-
82
-
83
-
84
-
85
-
86
-
87
-
88
-
89
-
90
-
91
-
92
-
93
-
94
-
95
-
96
-
97
-
98
-
99
-
100
-
101
-
102
-
103
-
104
-
105
-
106
-
107
-
108
-
109
-
110
-
111
-
112
-
113
-
114
-
115
-
116
-
117
-
118
-
119
-
120
-
121
-
122
-
123
-
124
-
125
-
126
-
127
-
128
-
129
-
130
-
131
-
132
-
133
-
134
-
135
-
136
-
137
-
138
-
139
-
140
-
141
-
142
-
143
-
144
-
145
-
146
-
147
-
148
-
149
-
150
-
151
-
152
-
153
-
154
-
155
-
156
-
157
-
158
-
159
-
160
-
161
-
162
-
163
-
164
-
165
-
166
-
167
-
168
-
169
-
170
-
171
-
172
-
173
-
174
-
175
-
176
-
177
-
178
-
179
-
180
-
181
-
182
-
183
-
184
-
185
-
186
-
187
-
188
-
189
-
190
-
191
-
192
-
193
-
194
-
195
-
196
-
197
-
198
-
199
-
200
-
201
-
202
-
203
-
204
-
205
-
206
-
207
-
208
-
209
-
210
-
211
-
212
-
213
-
214
-
215
-
216
-
217
-
218
-
219
-
220
-
221
-
222
-
223
-
224
 |
 |

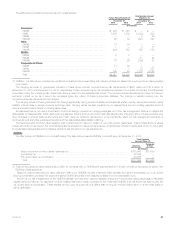
Summary of Primary Sources and Uses of Liquidity and Capital
Our primary sources and uses of liquidity and capital are summarized as follows:
Years Ended December 31,
2013 2012 2011
(In millions)
Sources:
Net cash provided by operating activities .......................................................... $16,131 $17,160 $10,273
Net cash provided by changes in policyholder account balances ....................................... — 4,290 4,321
Net cash provided by changes in payables for collateral under securities loaned and other transactions ......... — — 6,444
Net cash provided by changes in bank deposits .................................................... 8 — 96
Net cash provided by short-term debt issuances .................................................... 75 — 380
Long-term debt issued ........................................................................ 1,372 750 1,346
Cash received in connection with collateral financing arrangements, net .................................. — — 37
Net change in liability for securitized reverse residential mortgage loans .................................. — 1,198 —
Cash received in connection with redeemable noncontrolling interests ................................... 774 — —
Common stock issued, net of issuance costs ...................................................... 1,000 1,000 2,950
Net cash provided by other, net ................................................................. — 609 212
Effect of change in foreign currency exchange rates on cash and cash equivalents balances ................. — 11 —
Total sources ............................................................................. 19,360 25,018 26,059
Uses:
Net cash used in investing activities .............................................................. 15,165 11,929 22,218
Net cash used for changes in policyholder account balances .......................................... 5,681 — —
Net cash used for changes in payables for collateral under securities loaned and other transactions ............ 3,276 29 —
Net cash used for changes in bank deposits ....................................................... — 4,169 —
Net cash used for short-term debt repayments ..................................................... — 586 —
Long-term debt repaid ........................................................................ 1,746 1,702 2,042
Collateral financing arrangements repaid .......................................................... — 349 502
Cash paid in connection with collateral financing arrangements ......................................... — 44 —
Redemption of convertible preferred stock ......................................................... — — 2,805
Preferred stock redemption premium ............................................................. — — 146
Dividends on preferred stock ................................................................... 122 122 122
Dividends on common stock ................................................................... 1,119 811 787
Net cash used in other, net .................................................................... 192 — —
Effect of change in foreign currency exchange rates on cash and cash equivalents balances ................. 212 — 22
Total uses ................................................................................ 27,513 19,741 28,644
Net increase (decrease) in cash and cash equivalents ................................................. $(8,153) $ 5,277 $ (2,585)
Cash Flows from Operations
The principal cash inflows from our insurance activities come from insurance premiums, annuity considerations and deposit funds. The principal
cash outflows relate to the liabilities associated with various life insurance, property & casualty, annuity and group pension products, operating
expenses and income tax, as well as interest on debt obligations. A primary liquidity concern with respect to these cash flows is the risk of early
contractholder and policyholder withdrawal.
Cash Flows from Investments
The principal cash inflows from our investment activities come from repayments of principal on investments, proceeds from maturities of
investments, sales of investments, settlements of freestanding derivatives and net investment income. The principal cash outflows relate to purchases
of investments, issuances of policy loans and settlements of freestanding derivatives. Additional cash outflows include those related to our securities
lending activities and purchases of businesses. We typically have a net cash outflow from investing activities because cash inflows from insurance
operations are reinvested in accordance with our ALM discipline to fund insurance liabilities. We closely monitor and manage these risks through our
credit risk management process. The primary liquidity concerns with respect to these cash flows are the risk of default by debtors and market
disruption.
Financing Cash Flows
The principal cash inflows from our financing activities come from issuances of debt, issuances of MetLife, Inc.’s securities, and deposits of funds
associated with PABs. The principal cash outflows come from repayments of debt, payments of dividends on MetLife, Inc.’s securities and
withdrawals associated with PABs. The primary liquidity concerns with respect to these cash flows are market disruption and the risk of early
contractholder and policyholder withdrawal.
62 MetLife, Inc.